The Atlantic Ocean currents are getting very unstable and are close to a tipping point of no return. That is what a new study shows, with the ocean currents nearing a critical point, likely induced by the increased fresh water from the melting ice and the effects of changing ocean currents already being felt.
These ocean currents play a very important role in the weather patterns over the United States, Canada, and Europe. The latest data suggests that the melting ice has added a large amount of freshwater into the North Atlantic, impacting the ocean currents.
We will look at the latest data on the Atlantic Ocean currents, how they shape our weather, and why they have weakened in the past years/decades. We will also look at how the weather patterns will change once these ocean currents go beyond the tipping point and collapse.
NORTH ATLANTIC OCEAN CURRENTS
The North Atlantic ocean currents are a part of a large system called AMOC. This powerful ocean system brings warmer waters up from the Gulf of Mexico into the North Atlantic Ocean, hence also the name “Gulf Stream”. It extends all the way up along the eastern coast of the United States, where it starts to turn towards northern Europe.
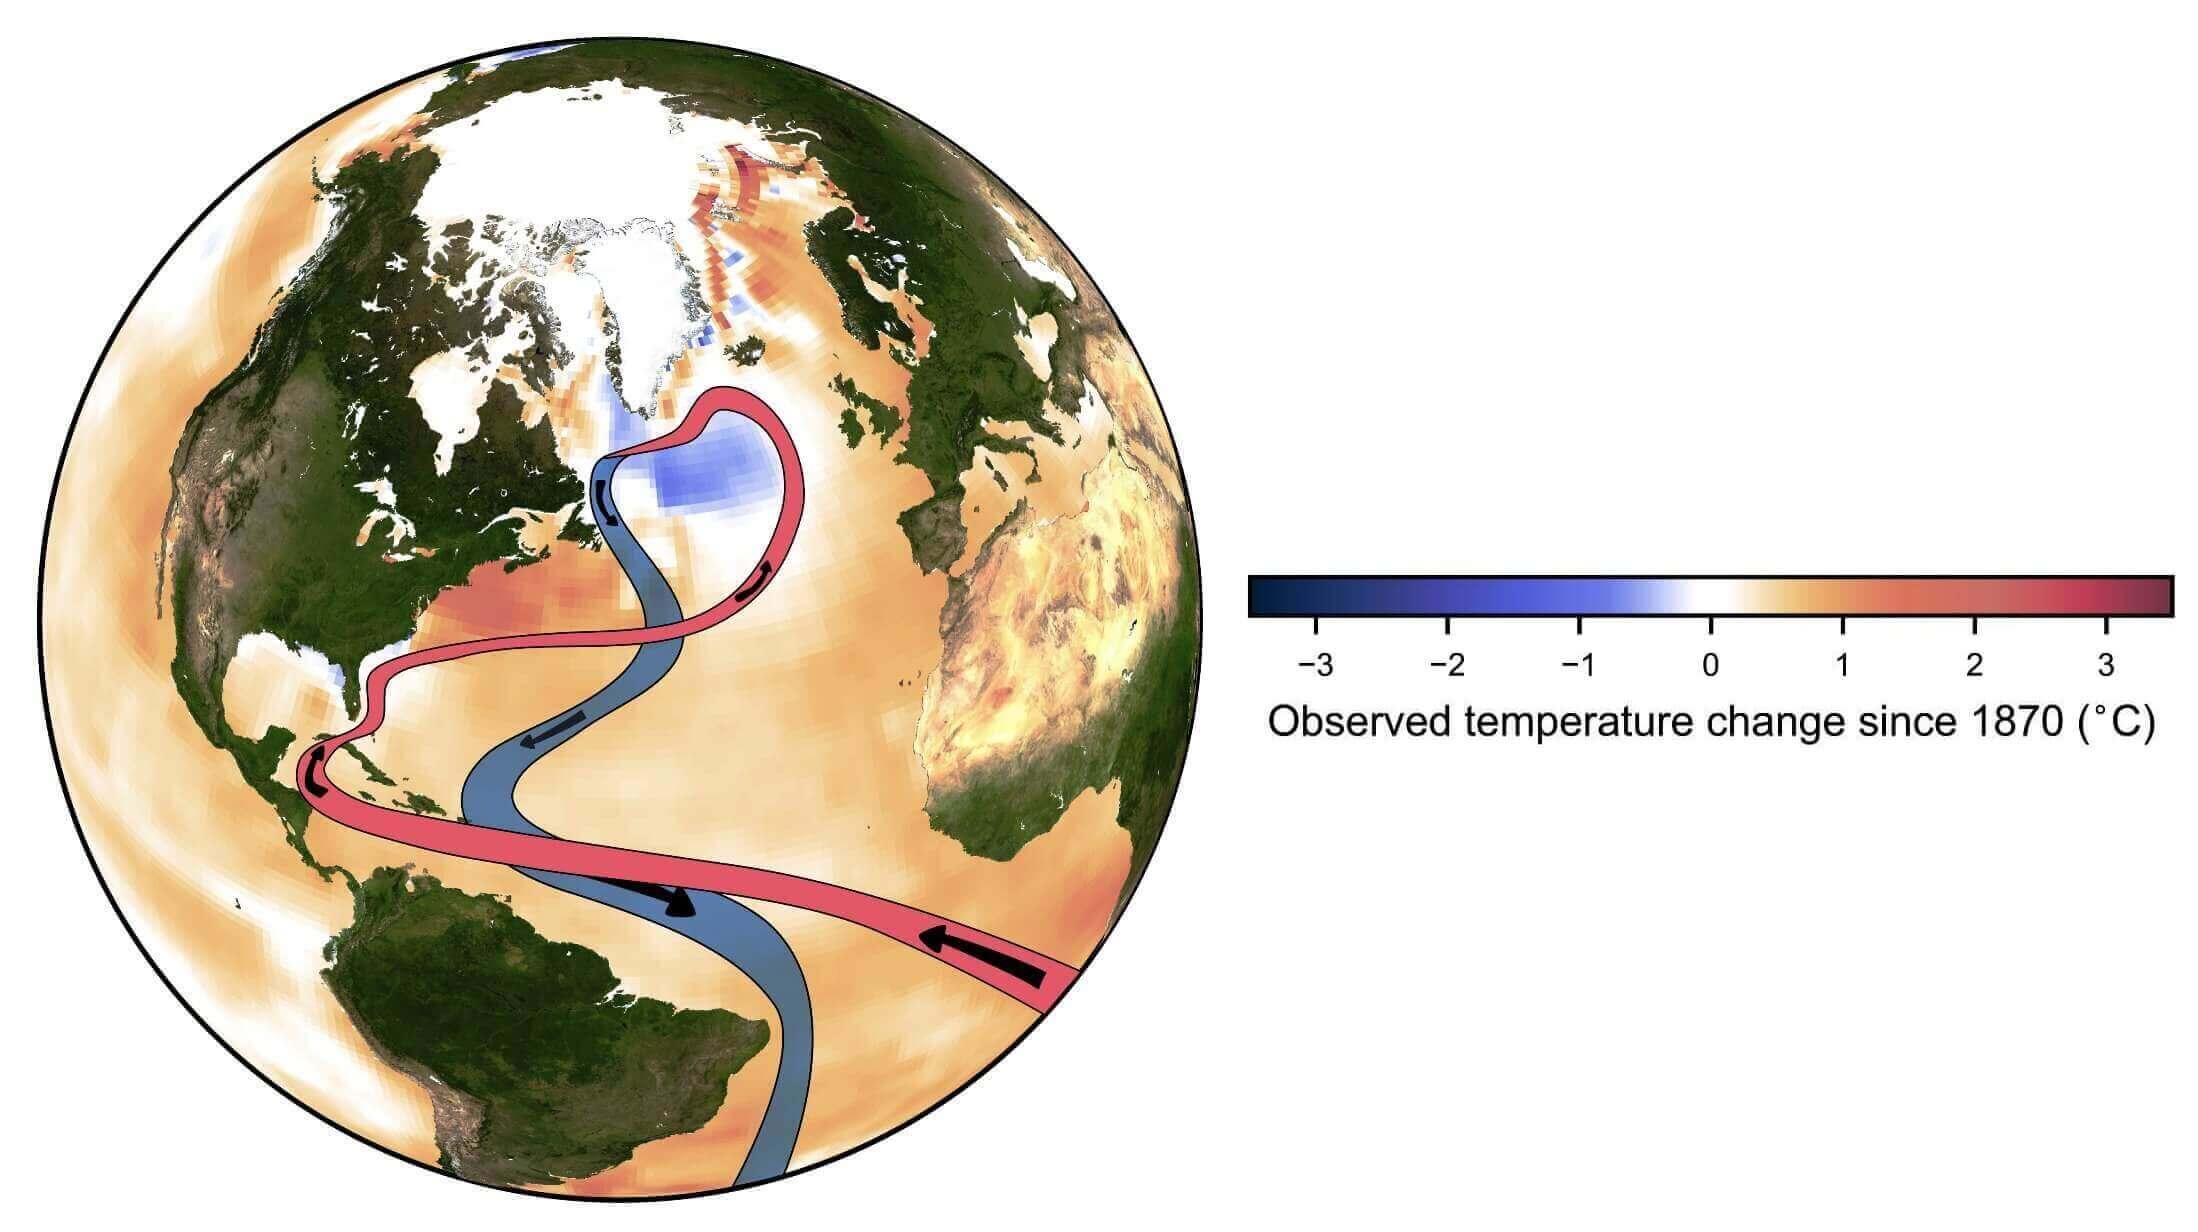
The image below shows a general outline of the Atlantic Ocean current and where it flows across the North Atlantic. It does not actually flow in such a nice straight line, but as you will see, it is very complex and full of motion and dynamics.
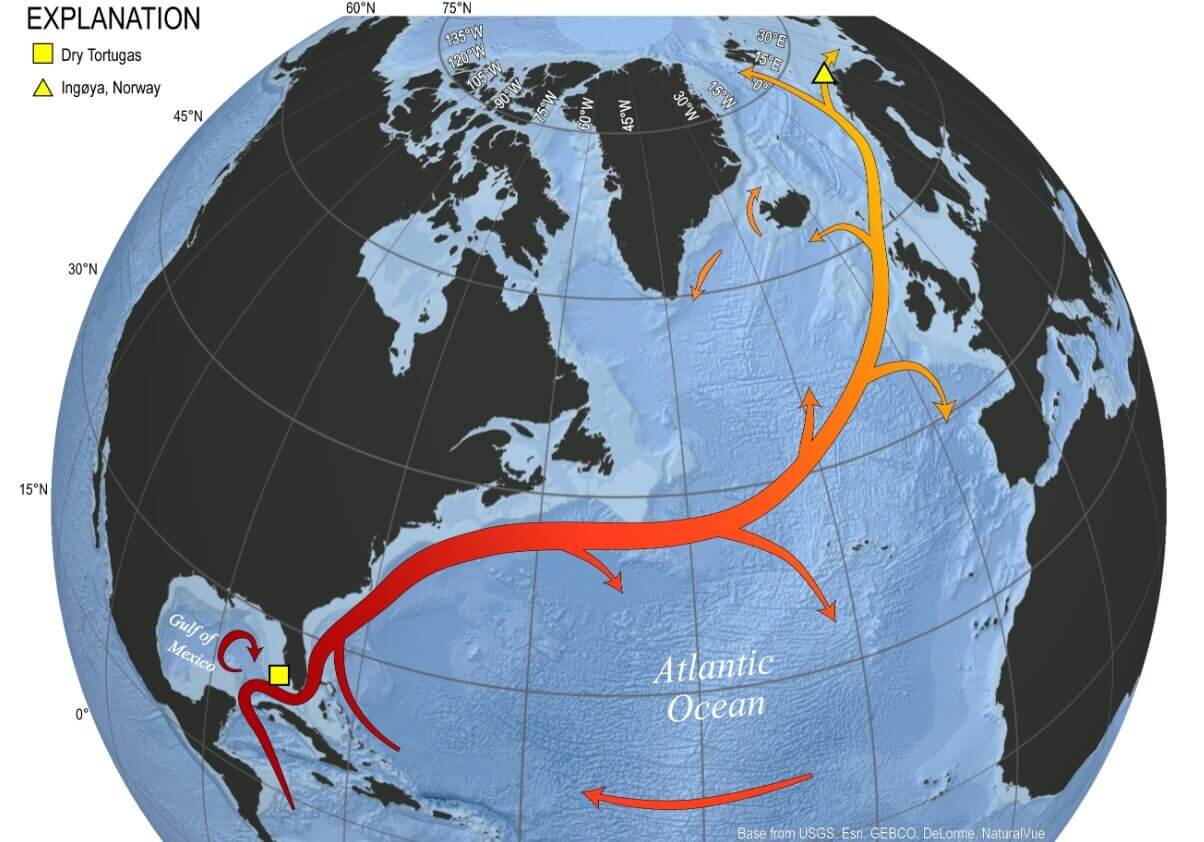
This strong current of warm water influences the climate of Florida directly. Compared to other southeastern states, it keeps temperatures in Florida warmer in the winter and cooler in the summer. This is just one example of the direct impact this current has on the United States.
Since the Gulf Stream also extends towards Europe, it helps to warm the Western European countries, having a major impact on the regional climate and also impacting northern parts of the continent.
We can actually see this current if we look at the ocean temperatures and the surface currents. Below is the latest ocean current analysis that reveals the Gulf Stream. It starts its way in the Gulf of Mexico, turning around Florida, flowing up along the east coast of the United States, and then out into the North Atlantic.
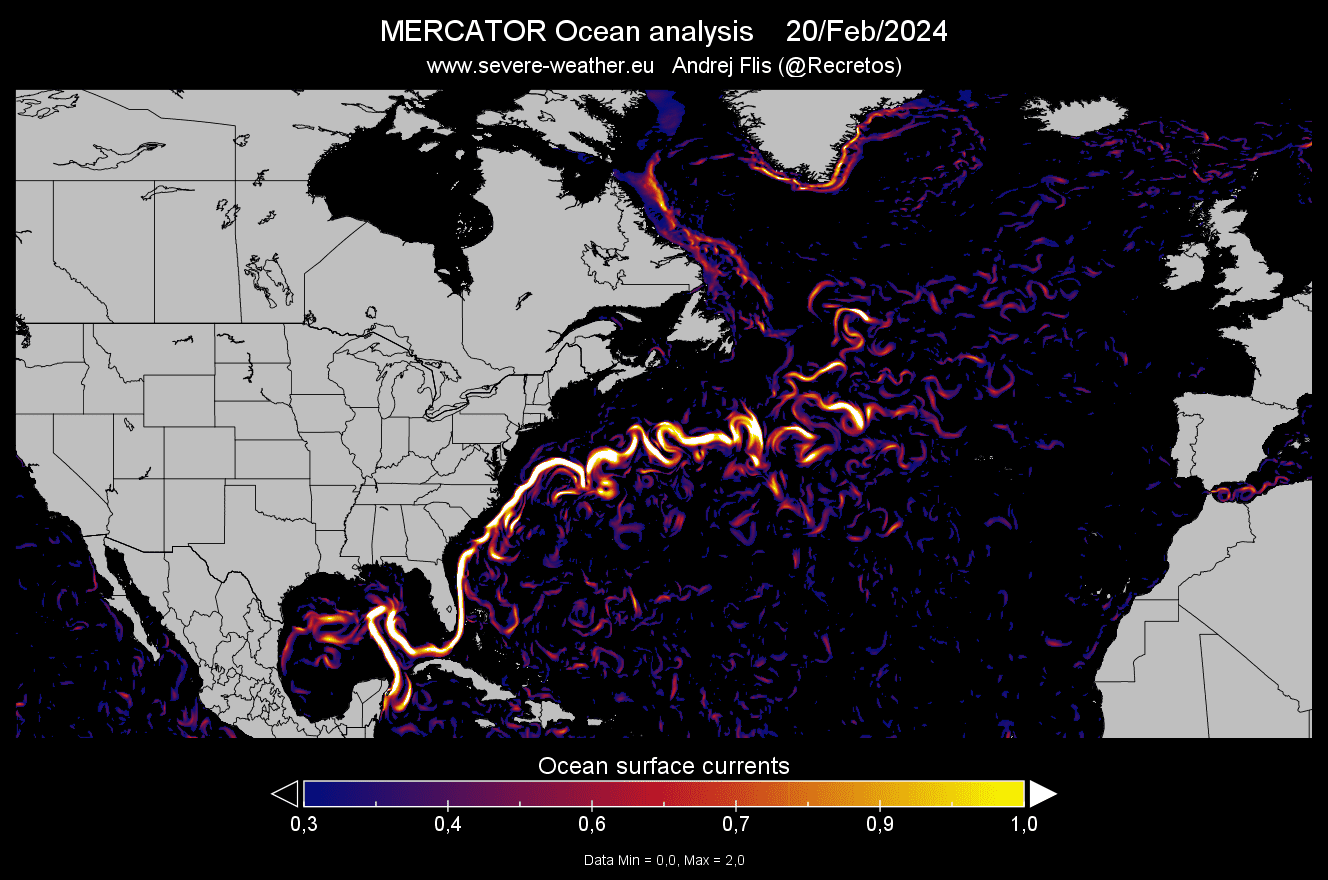
No ocean current ever flows in a straight line, as seen in many graphics. It is actually very complex, with a lot of dynamics and swirling across the North Atlantic. It has a lot of smaller swirls of water, both warm and cold, very similar to the jet stream in the atmosphere.
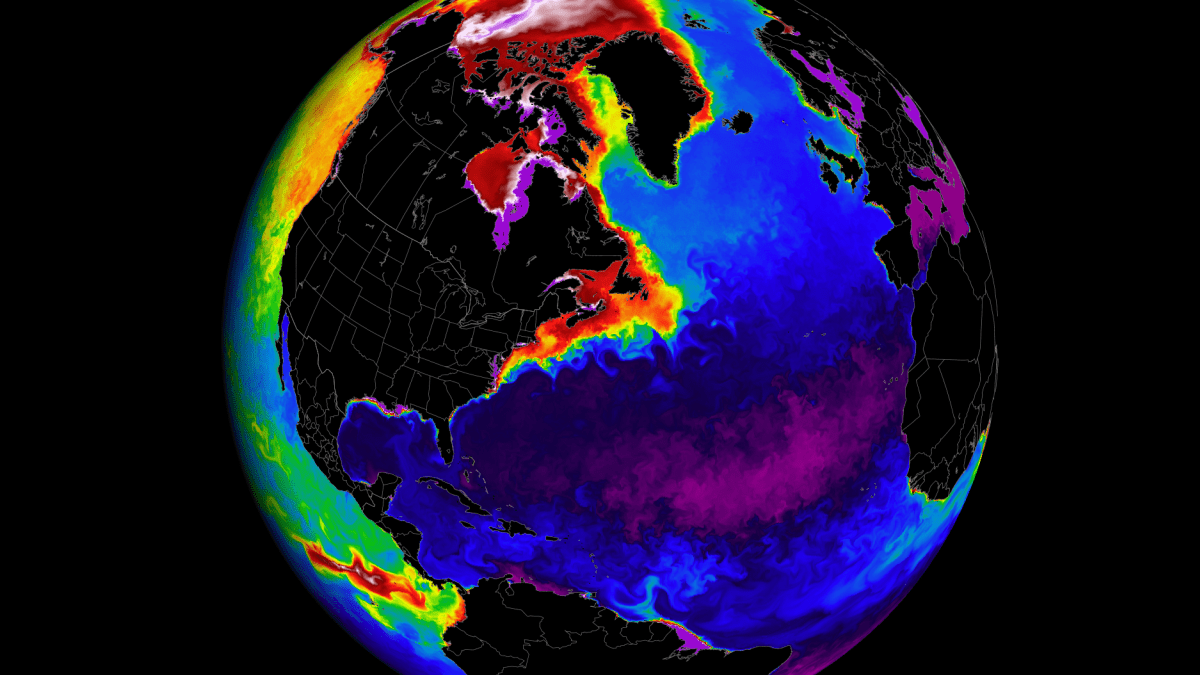
In the next image below, you can see the latest ocean surface temperature. Notice the warm stream of water moving up along the eastern coast of the United States and extending out into the North Atlantic.
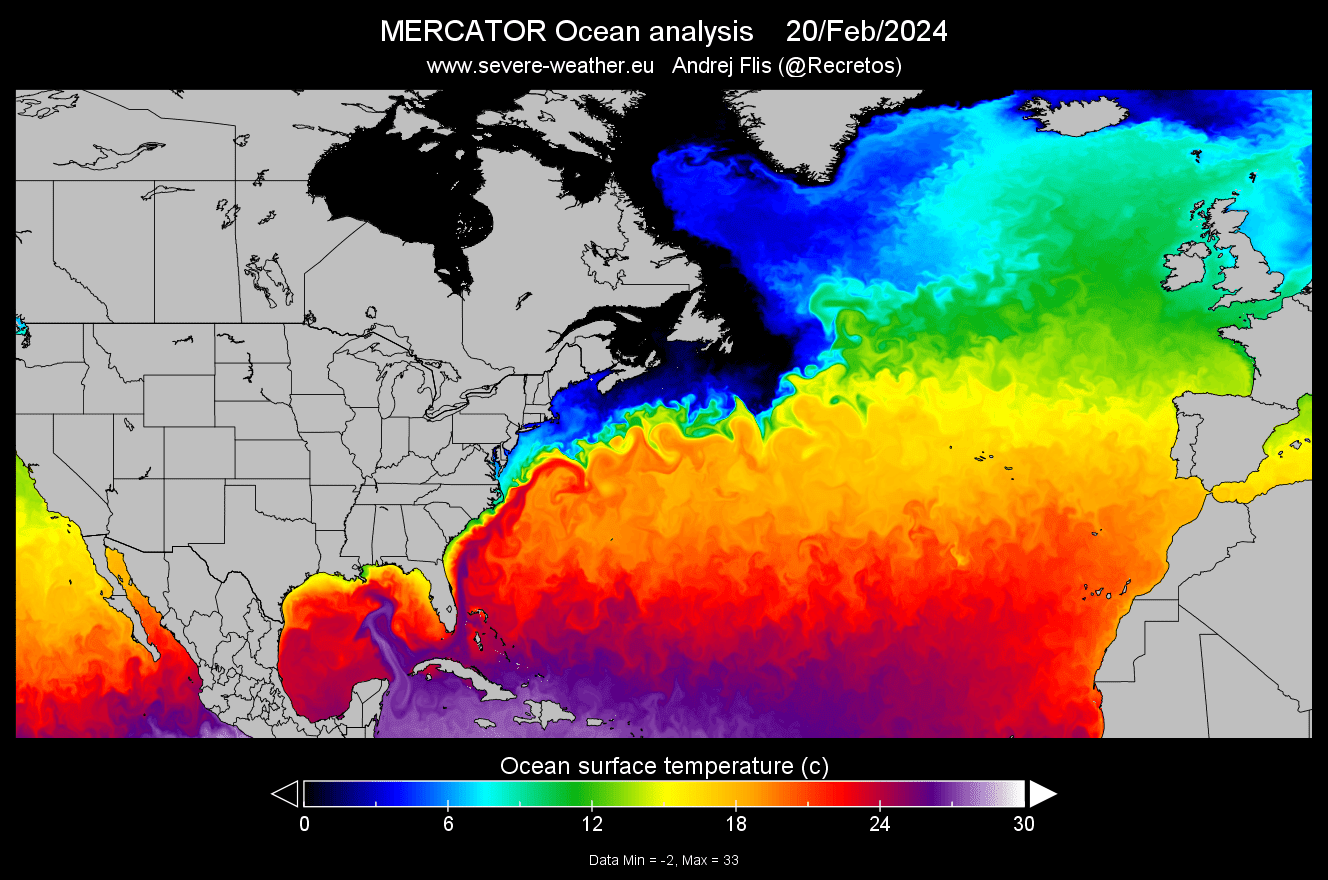
This is the Gulf Stream at its best, transporting essential warm waters further up to the North. In contrast, you can see the cold Labrador Current flowing down along the east Canadian coast. They both have a very interesting dynamic that can be better seen in a video animation.
We produced a high-resolution video animation that shows the Gulf Stream in motion. You can see how it flows into the North Atlantic.
With all this transport of warm water and energy, how does the Gulf Stream impact our weather on a larger scale?
OCEAN CURRENTS AND WINTER WEATHER
We produced a special graphic below, which shows why the Gulf Stream and the AMOC are so fundamental to the climate of the Northern Hemisphere. The image shows the average January surface temperature in the past decades. Notice the large temperature difference between the far North Atlantic and Canada, for example.
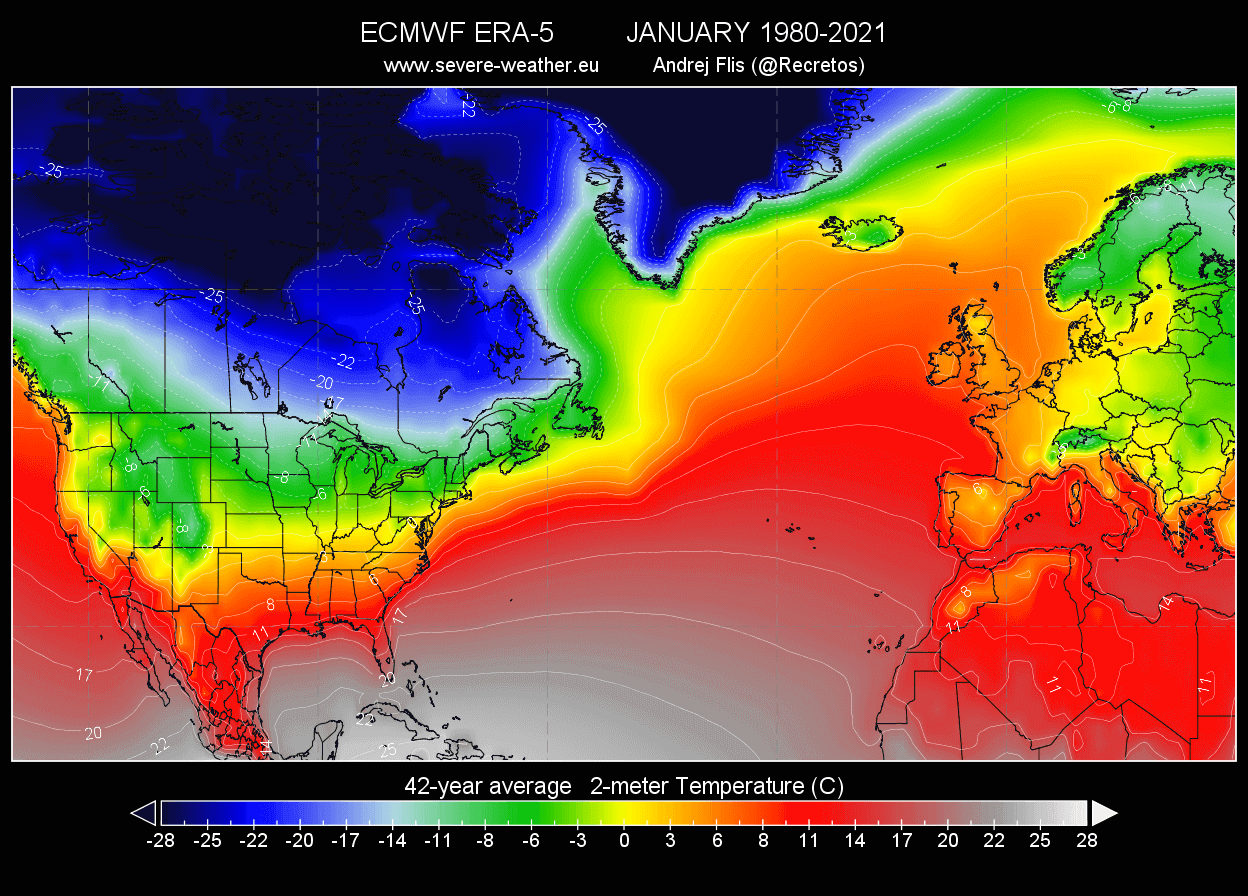
Looking at the same latitude line, for example, 60 degrees North, along the tip of Greenland. You can see that there is a temperature difference of almost 30 degrees Celsius between the North Atlantic and southern Canada.
Also, the difference in winter climate between the United Kingdom and southern Canada is really substantial. This is in large part because of the warm Gulf Stream. It brings warmer waters towards the North, keeping the climate milder in Europe.
Since a lot of our readers are more familiar with the Fahrenheit temperature scale, we also produced the same graphic, but in Fahrenheit degrees. You can see the large difference of 50-60 degrees F between the far North Atlantic and southern Canada.
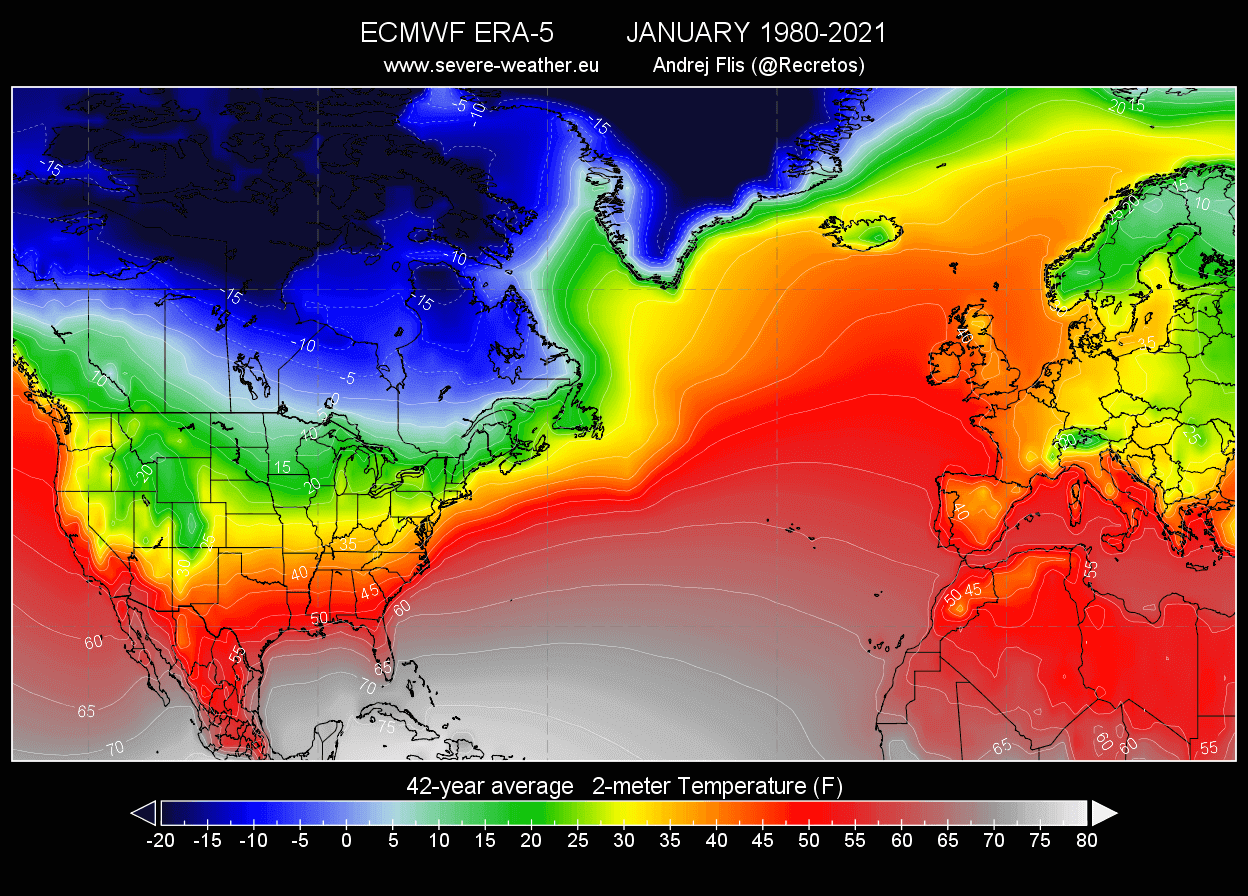
You can also see the warmer climate along the east coast of the United States. This is also partially due to the warm ocean current. But as you will see further down in the article, the Gulf Stream can also have a negative impact on weather in the United States.
But what we can see on the surface is just one part of the whole story. The whole system, called AMOC (Atlantic Meridional Overturning Circulation), also has a very important part in the far North Atlantic. It is an area where the warm surface currents cool down and sink deep into the ocean.
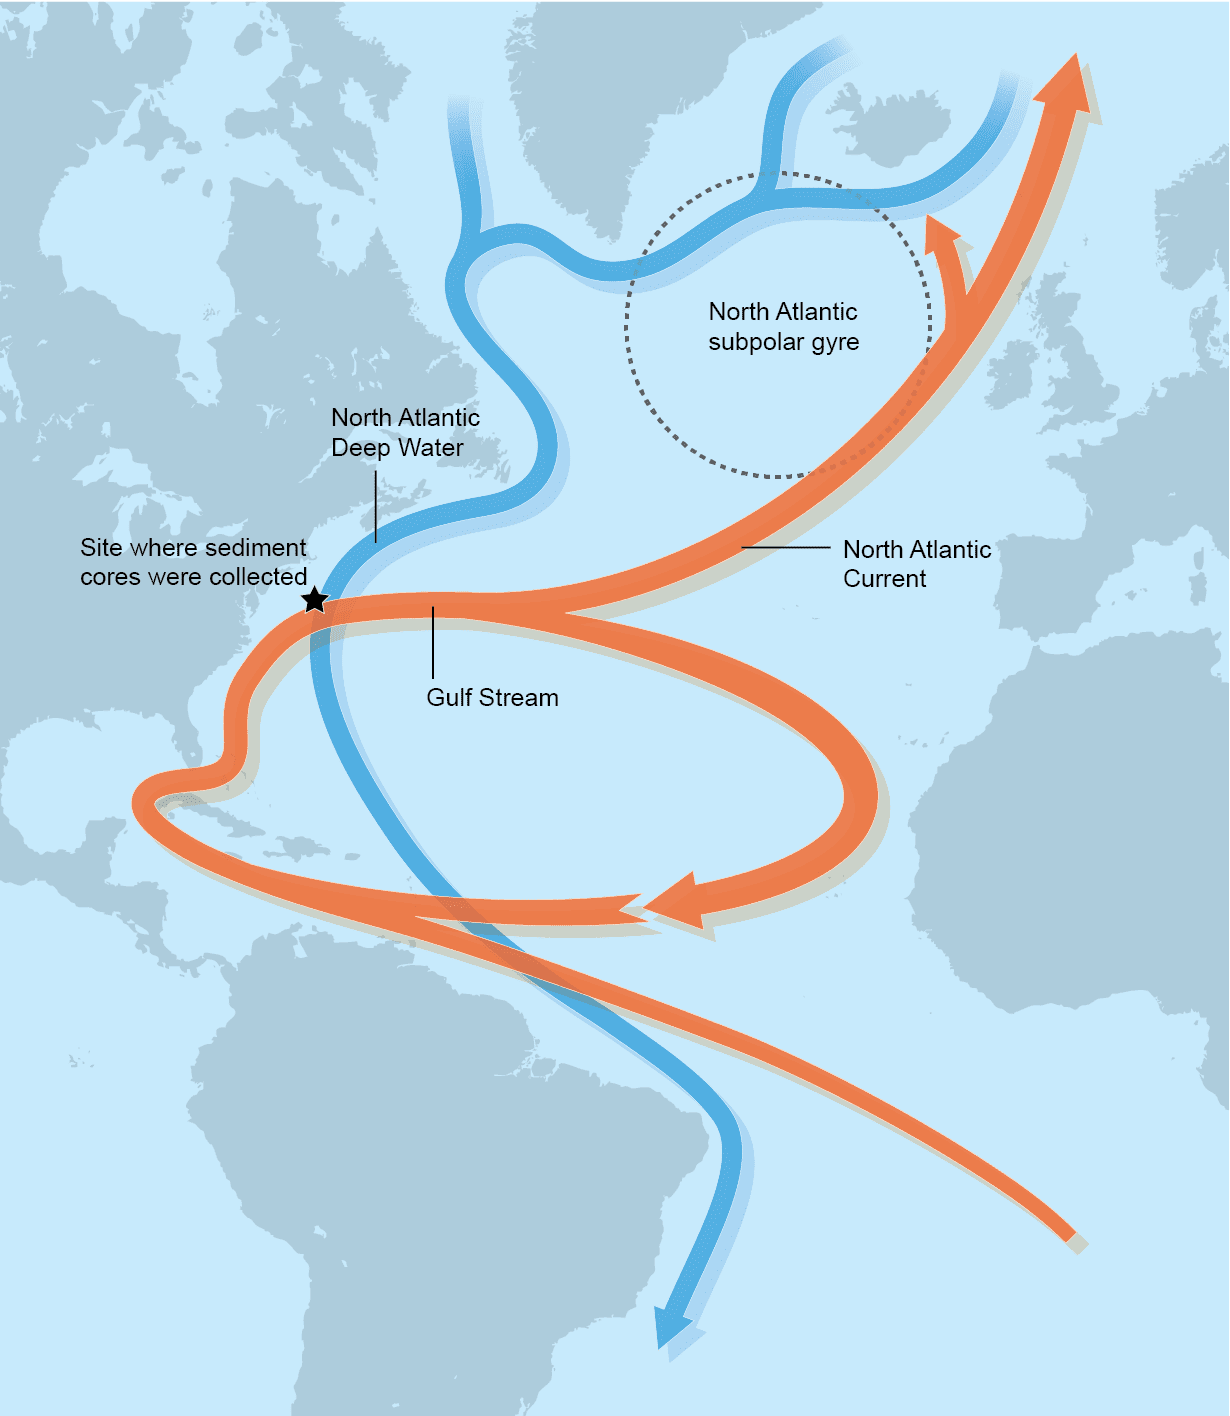
The image below shows the outline of the AMOC, with the warm surface currents in orange and the colder, deeper currents in blue. You can also see the area where they “overturn” in the far North Atlantic, called the subpolar gyre.
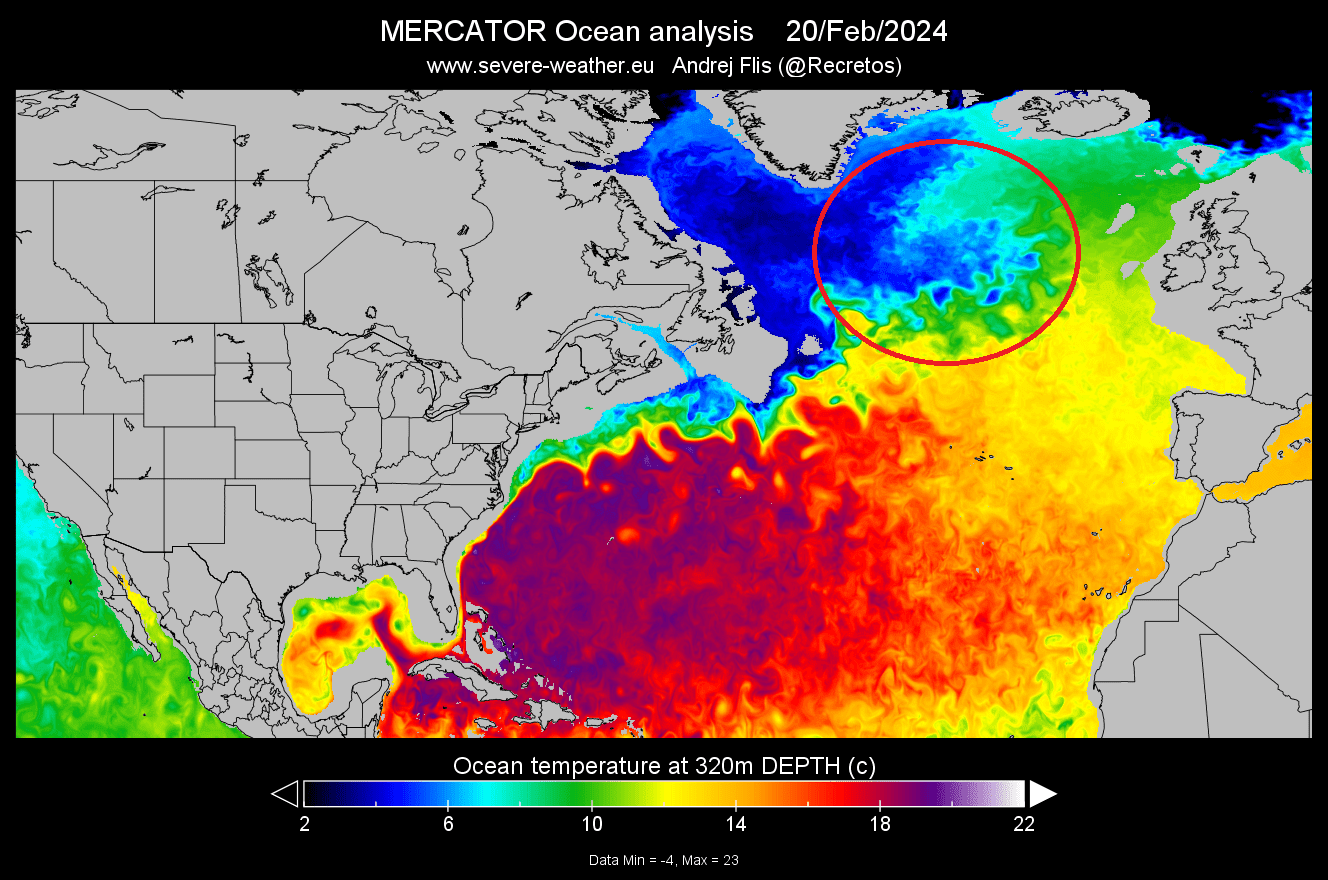
If we look deeper down below the surface, at around 320 meters (1050ft), the Gulf Stream is still nicely seen. But you can also see the far north Atlantic, where the overturning happens and where the warm surface currents turn around and sink down into the depths.
But what is actually driving the ocean currents in the North Atlantic?
As the Gulf Stream transports warmer waters northwards, it gradually cools as it releases heat into the atmosphere. Evaporation also occurs, increasing the salt concentration in the ocean.
Lower temperatures and a high salt content make the water denser and heavier. This means that it will sink down deeper into the ocean. Sinking water causes movement and momentum, pulling down more water from the surface and creating a stable flow.
The image below shows ocean surface salinity or the amount of salt in the water. The higher the number, the saltier the water. Above 35, we still have salty waters, so as the water cools, it gets denser (heavier), and starts to sink.
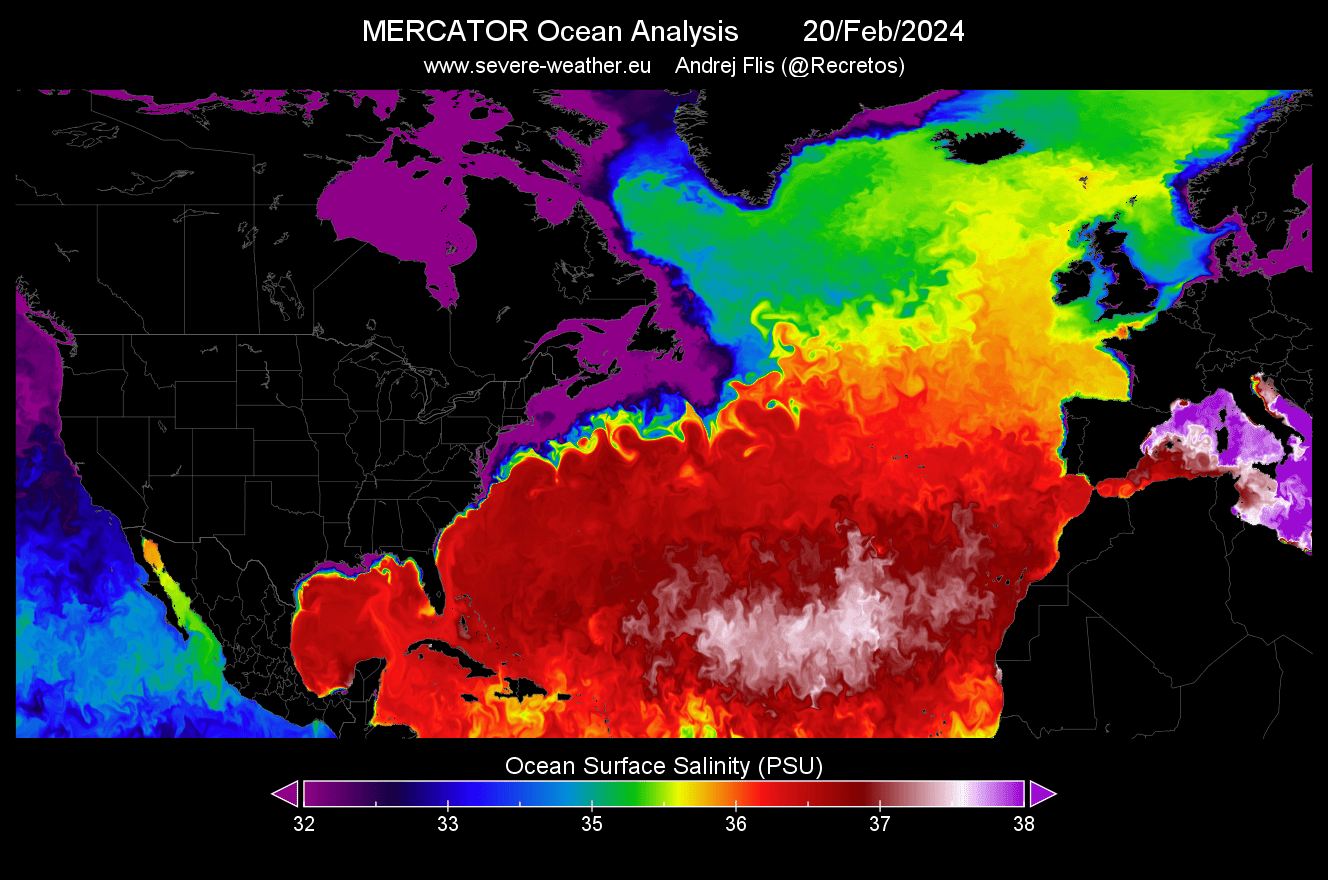
The cold, dense water slowly flows southwards, several kilometers below the ocean surface. Eventually, it gets pulled back to the surface and warms in a process called “upwelling”, completing the entire circulation circle.
This is the key to why the Gulf Stream may be slowing down. As there is more fresh water from the melting ice, it reduces the surface salinity, making the water less dense and thus harder to sink.
Because the surface waters can’t sink properly, they tend to stall and slow down the whole current. Similar to cars on the road starting to slow down, creating a whole traffic jam behind.
OCEAN CURRENTS SLOWING DOWN
There is a theory that the Gulf Stream might shut down at some point, making the movie “The Day After Tomorrow” a reality. In that famous movie, the North Atlantic Ocean circulation has completely shut down, pushing the world into a new ice age.
The movie is not really scientifically accurate, as these global changes do not happen in just a few days. But the main idea behind the movie is not far from the truth, as you will see.
Going directly to the point, we have a graphic below that shows the strength of the AMOC over the past centuries. Of course, these are reconstructions based on “proxy data”, like coral data, ocean sediments, and land-based data.
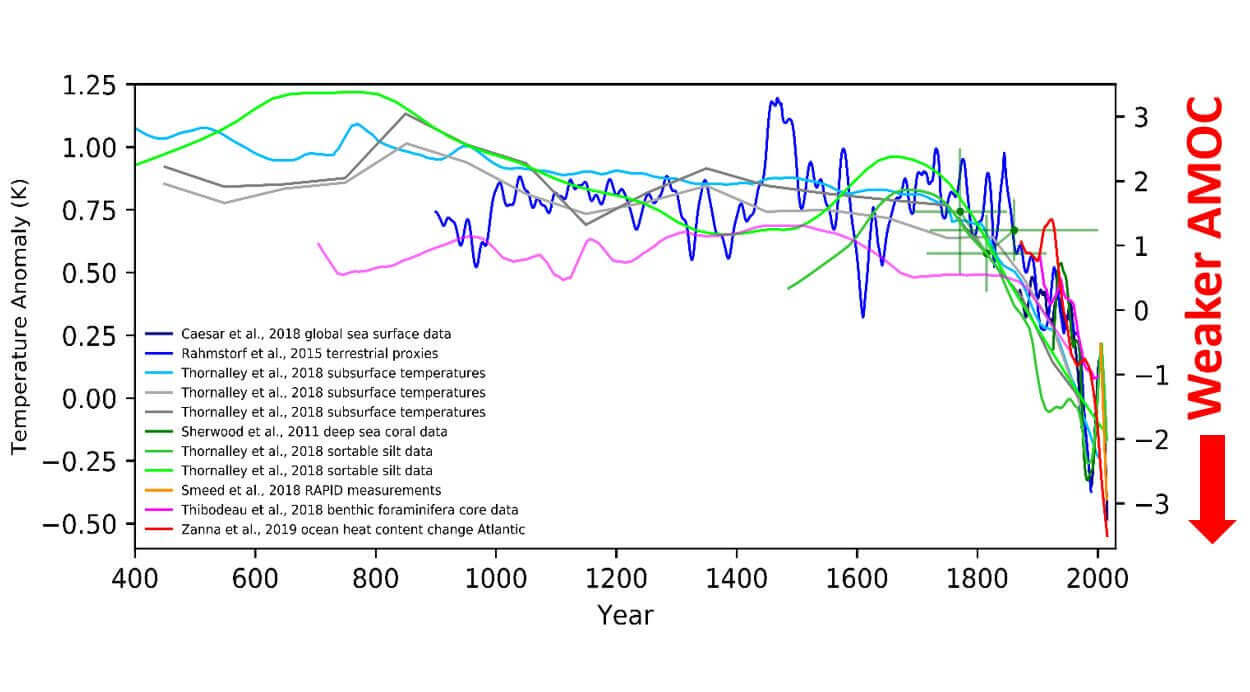
The most important takeaway is that we can see an intense weakening of the AMOC in at least the past 200-300 years. This reconstructed data agrees with the modern instrument observations. That gives it good confidence for the historical reconstruction part.
Most often, the ocean temperatures are being used to determine the state/strength of the Gulf Stream and the entire North Atlantic current circulation.
The image below shows the North Atlantic Ocean divided into two areas. On the eastern coast of the United States, we have the warm Gulf Stream area. But in the subpolar North Atlantic, we have the blue area, where the Gulf Stream releases its heat and sinks down into the depths.
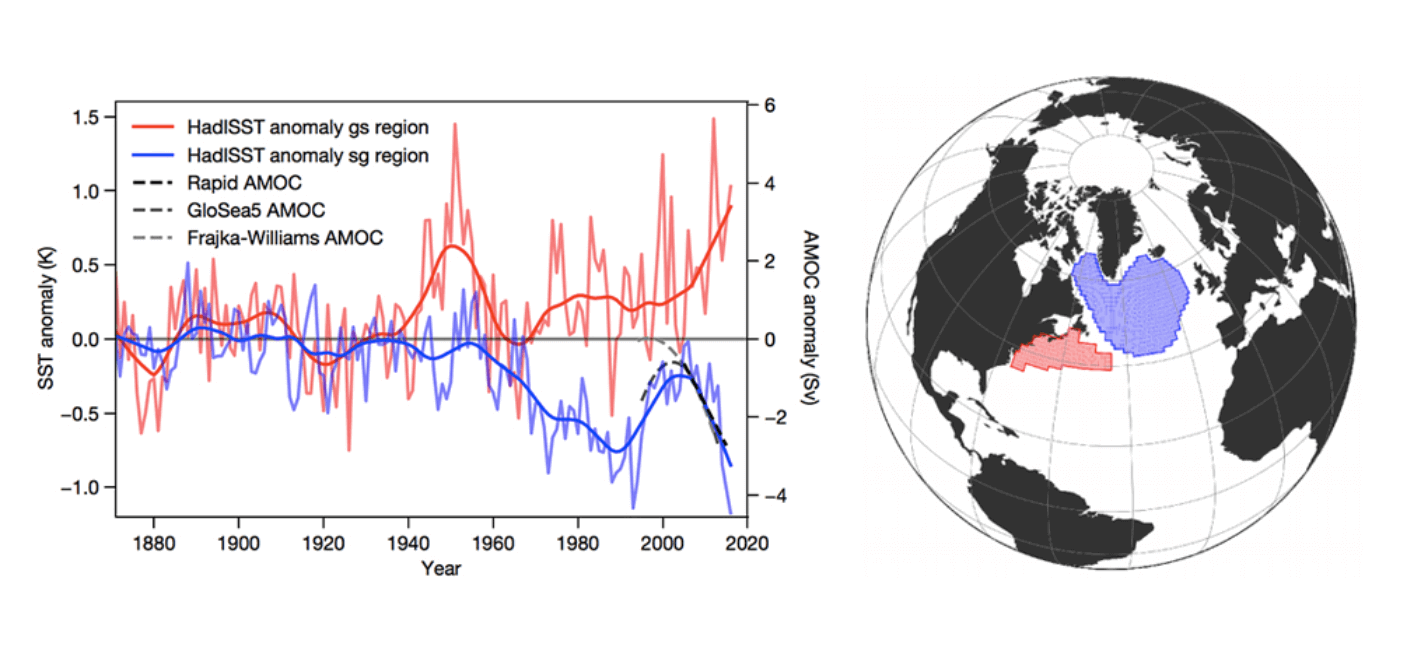
The graphs on the left show temperature progression over time. You can see that the Gulf Stream area is warming while the North Atlantic is actually cooling over time. This difference between these two areas is typically used as an estimate of the strength of the AMOC, as it is a heat transport system.
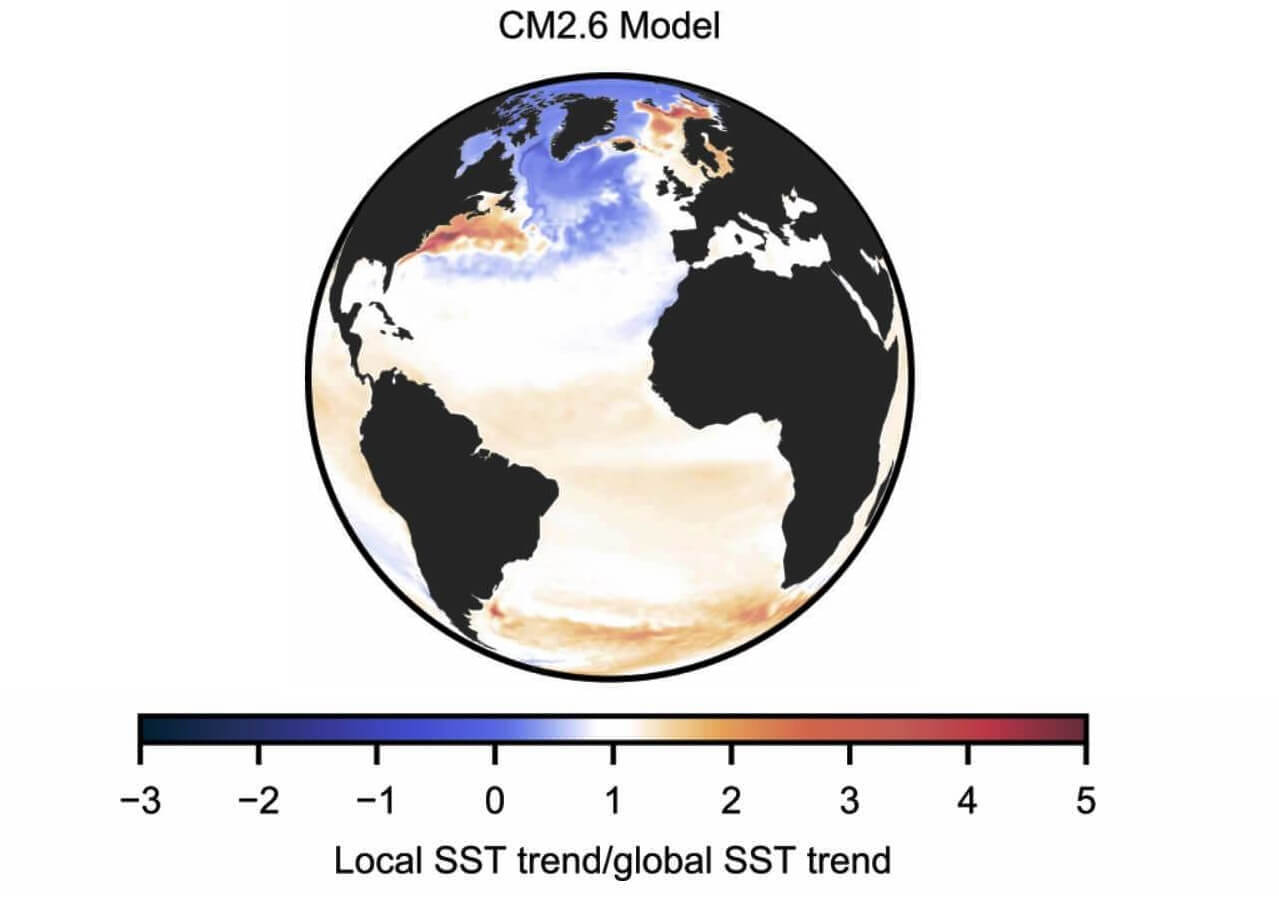
The next graphic below shows an even better example of the changing Gulf Stream. It is a computer model simulating a weakening of the AMOC and how the resulting ocean anomalies would look. We can see the warming of the Gulf Stream region along the east coast of the United States and cooling in the far North Atlantic.
In the image below, you can see the actual ocean temperature trends over time. It looks pretty much the same as the model simulation of a weakening AMOC. This supports the fact that the AMOC is indeed losing its strength, perhaps at a faster rate than first anticipated.
This temperature signature of the warm Gulf Stream area and cold North Atlantic is one of the strongest indicators that the AMOC is weakening. There are also observations being made with instruments, which objectively confirmed that the North Atlantic circulation is indeed on the decline.
The idea is that a weakening Gulf Stream cannot transport the warmer waters toward the north as effectively as it is slowing down (think on the traffic jam analogy). That results in warmer waters starting to pile up along the east coast of the United States.
As a result, the North Atlantic starts to cool down because it is not receiving as much warm water anymore via the Gulf Stream.
But what is the actual cause for the ocean currents to slow down, and why is the AMOC weakening overall? In the movie “The Day After Tomorrow”, the reasoning was that melting the Arctic and Greenland ice introduced lots of freshwater into the North Atlantic, creating a strong imbalance in the ocean current.
As you will now see, that is actually one thing that the movie probably got right.
A DISRUPTED BALANCE
Fresh water reduces the salinity of the North Atlantic. That makes the surface water less dense (and less heavy), so it can’t sink properly down to the depths. Because the ocean current can’t sink as fast, it’s causing a “traffic jam”, slowing down the entire current.
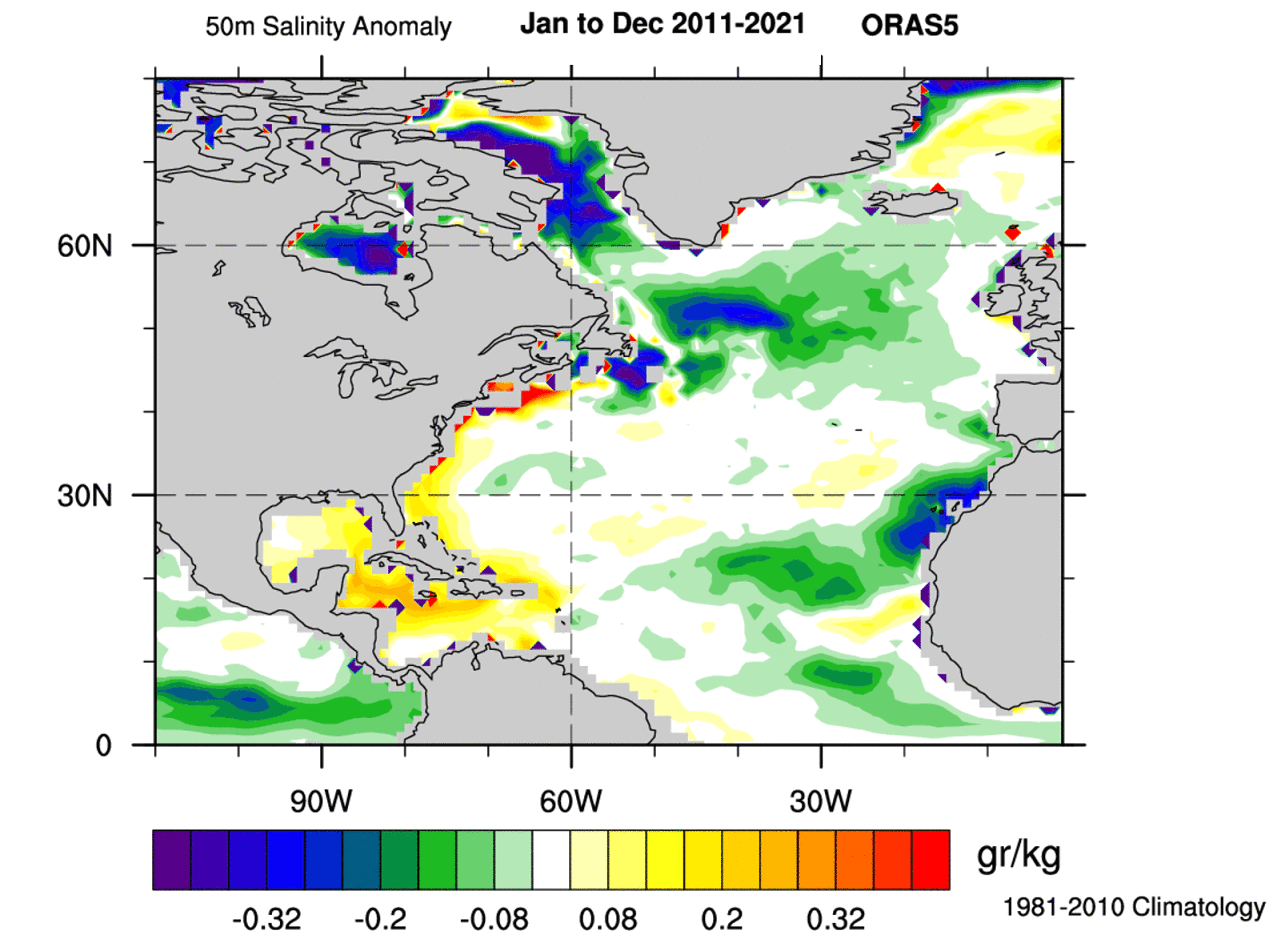
Looking below, we have the salinity anomaly for the last decade, and a bit deeper, at around 50 meters (164ft). You can see that the North Atlantic is fresher than normal. This strongly indicates that there is currently more fresh water in the North Atlantic than is normally expected.
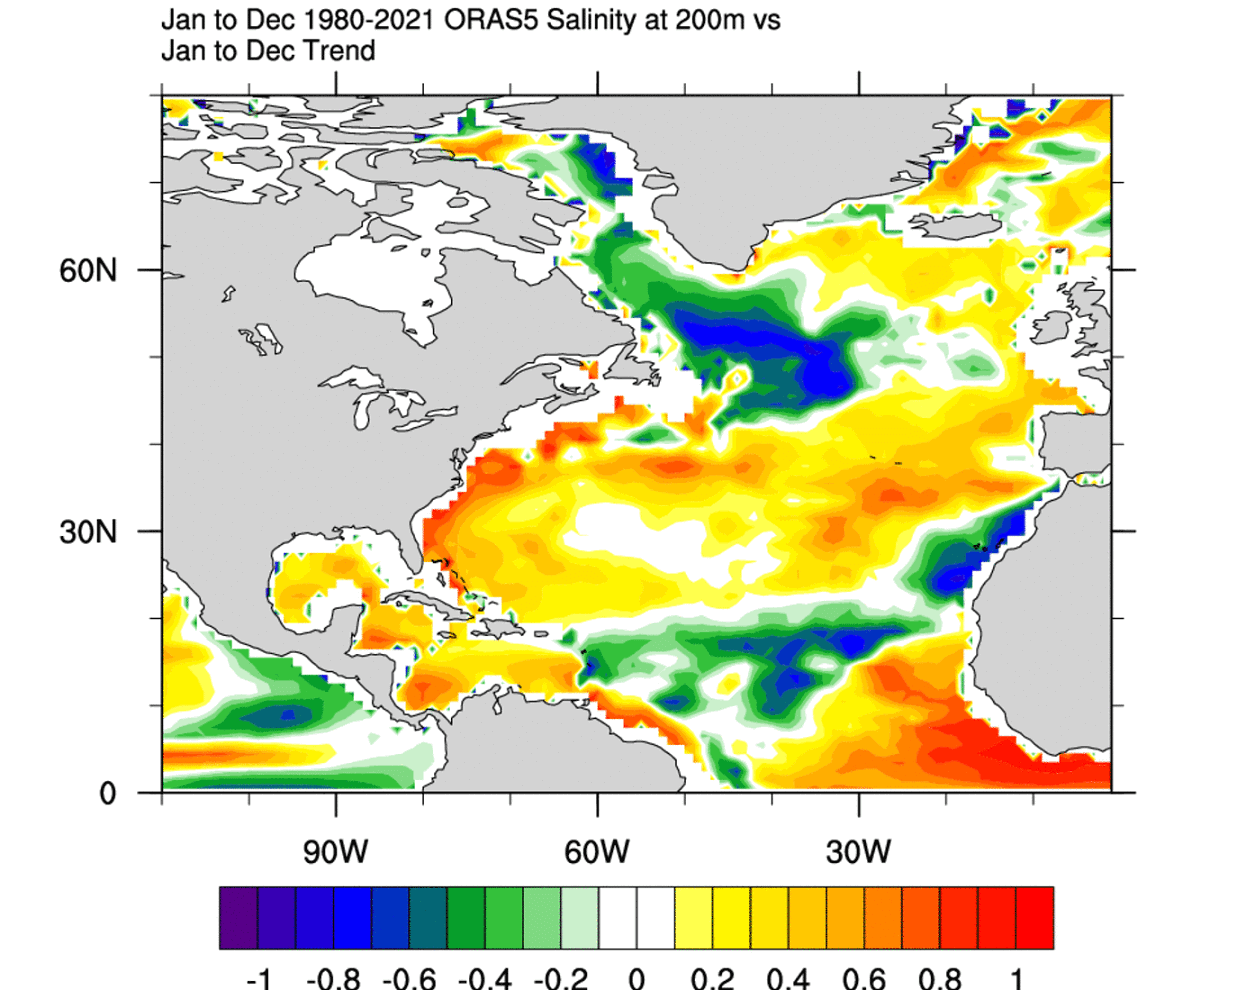
At 200m (656ft) depth, the story is the same. We can see a large part of the subpolar North Atlantic fresher than normal. That is directly in the area where the Gulf Stream starts to sink down into the depths, which indicates an inflow of fresher water. Data from ECMWF-ORAS5.
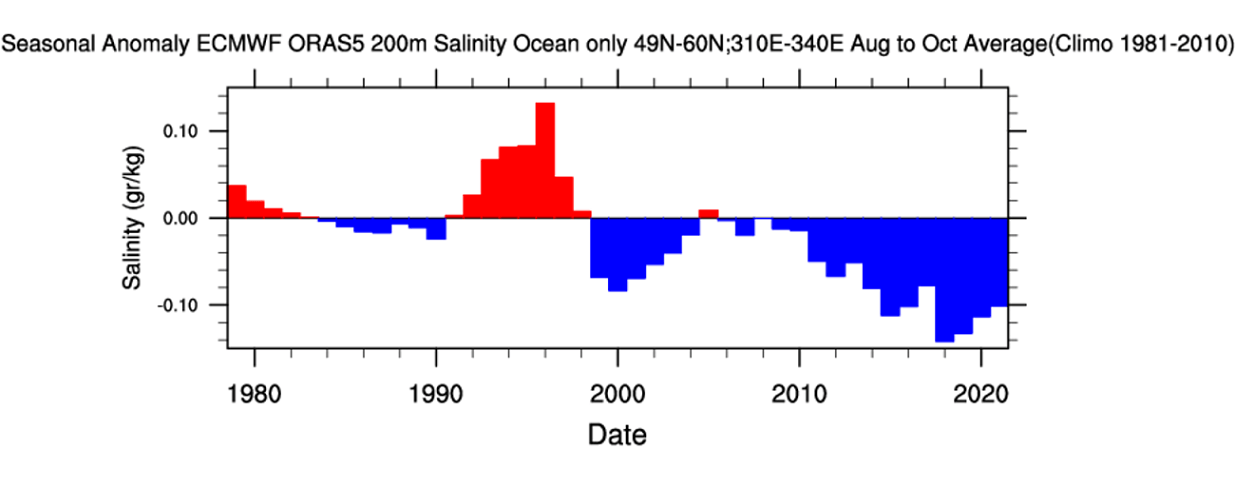
Below we have a graph that shows the salinity anomaly at 200m (656ft) depth, in the August-October period. This covers the latter warm season, with the highest rate of sea ice melt. It quite obviously shows that more freshwater is arriving in the North Atlantic, with the trend showing a decrease in salinity over the far North Atlantic.
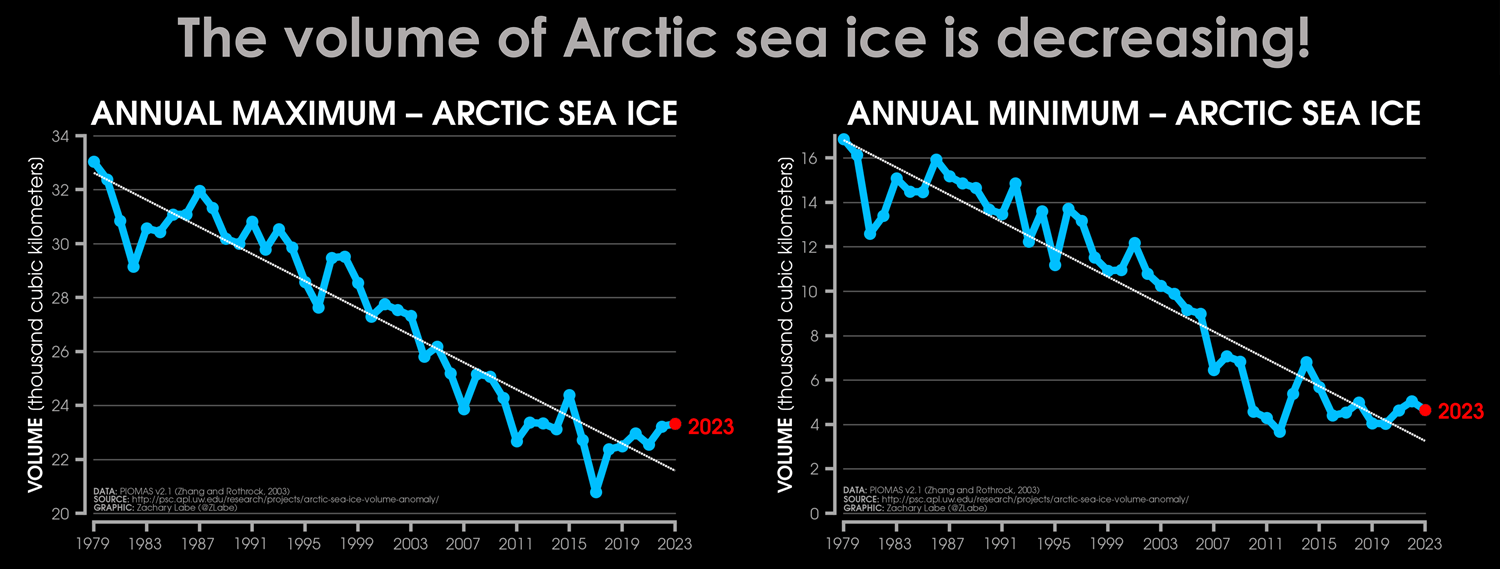
This freshening of the North Atlantic can also be traced to the Arctic Sea Ice anomalies. The graph below by Zack Labe actually shows the Arctic sea ice volume anomaly since 1979. We can see a gradual reduction of sea ice volume, meaning a stronger melt rate, and several millions of cubic kilometers of sea ice now melted away.
This is one thing that the movie “The Day After Tomorrow” got somewhat right if we ignore the time scale. But are we now facing a new ice age? The short answer is no. But we are not yet at a full collapse and shutdown of the Gulf Stream.
WEATHER ANOMALIES AFTER COLLAPSE
Using state-of-the-art computer systems, we can make a global simulation of what can be expected once we do reach that point. Many model simulations were made to try and calculate what would happen if the Atlantic Ocean currents would completely shut down. Below is the end result, which shows the temperature compared to a world with active currents.
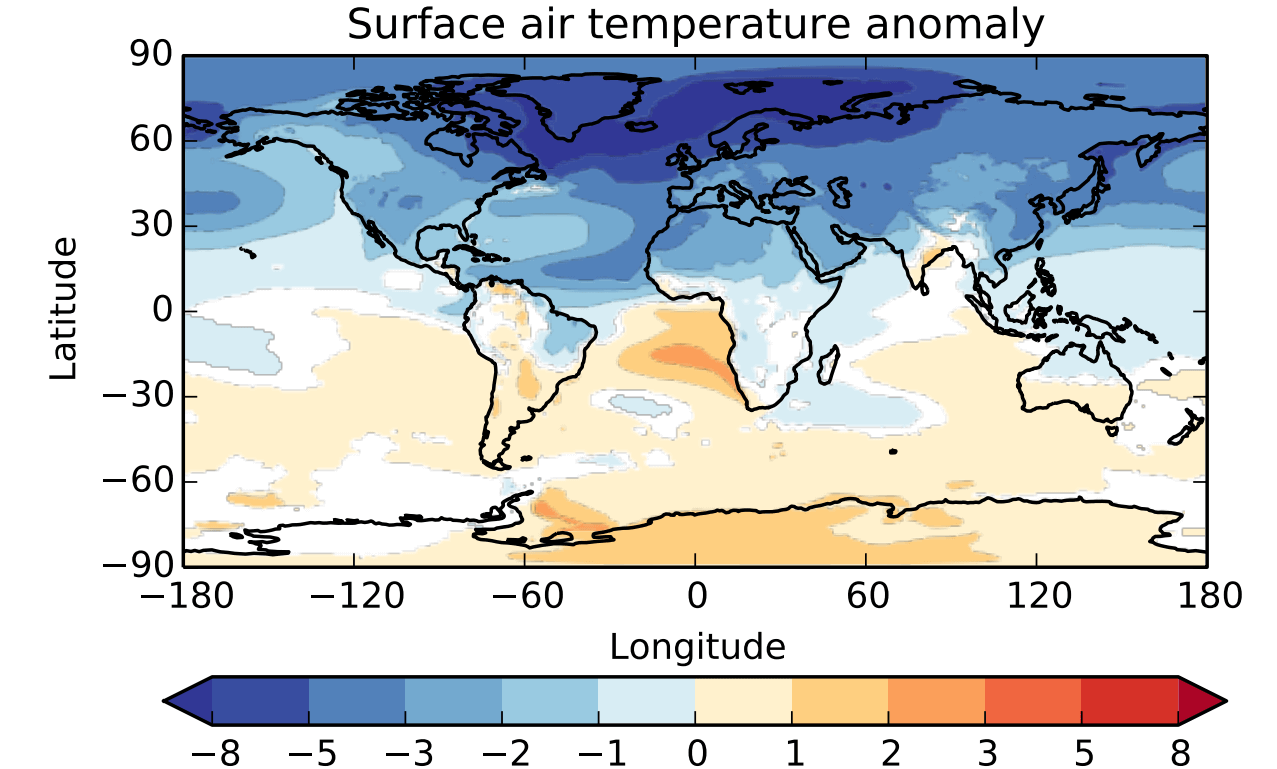
You can see that the entire Northern Hemisphere is under a colder anomaly as the temperatures would drop. And that is just the beginning. Strong climatic changes were to occur, with very different pressure patterns and precipitation distribution. Winters would become more severe in the United States and Europe.
This would partially counter the continuing warming. But it would introduce further severe destabilization of the already changing climate system. It does not mean a new ice age just yet, but the global weather changes can be quite substantial.
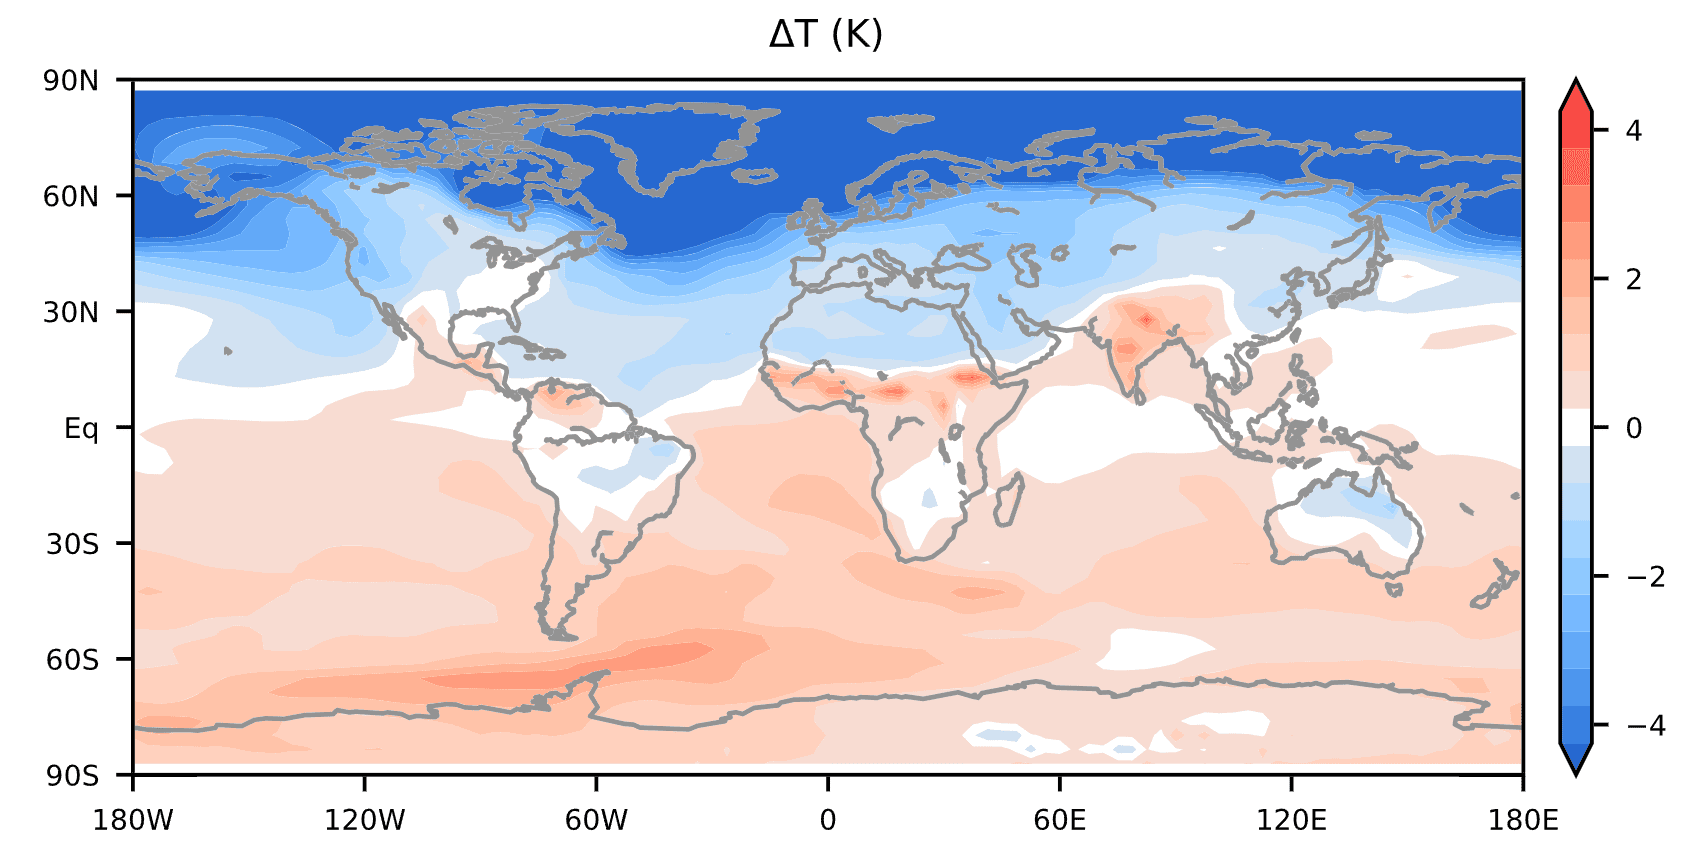
Another separate simulation also produced a very similar result. A temperature drop across much of the Northern Hemisphere. The Southern Hemisphere is shown as warmer because with the currents slowed down, there is less heat transported to the Northern Hemisphere.
In the image below from another simulation, we can also see the precipitation patterns. It shows less precipitation over much of the Northern Hemisphere, except for the southern United States. There, we can see an increase in precipitation under a collapsed ocean circulation.
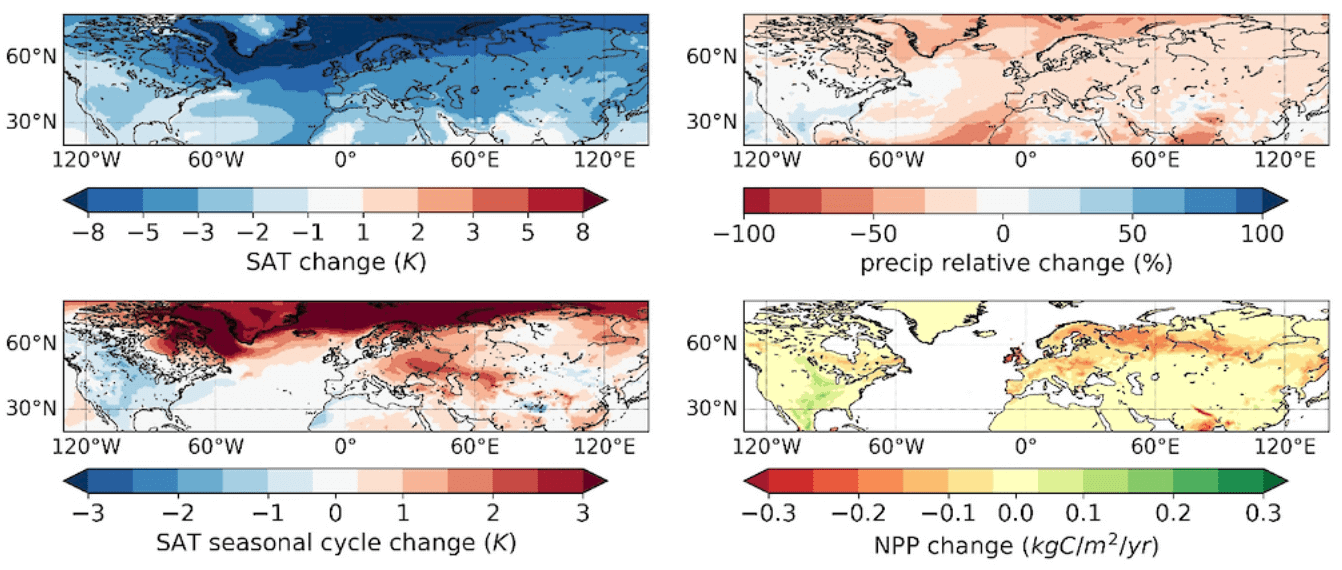
Combined with the seasonal temperature changes, this would mean colder winters across much of the Northern Hemisphere, with increased snowfall all the way into the deep south of the United States.
Europe would likely see less precipitation but still experiencing colder temperatures than normal overall.
So, while we do not see a new ice age starting right away from the collapse of the Gulf Stream System, the global weather changes are significant.
But we do not need a full collapse of the ocean circulation to change the weather. As the Gulf Stream slows down, that means more water piling up on the east coast of the United States.
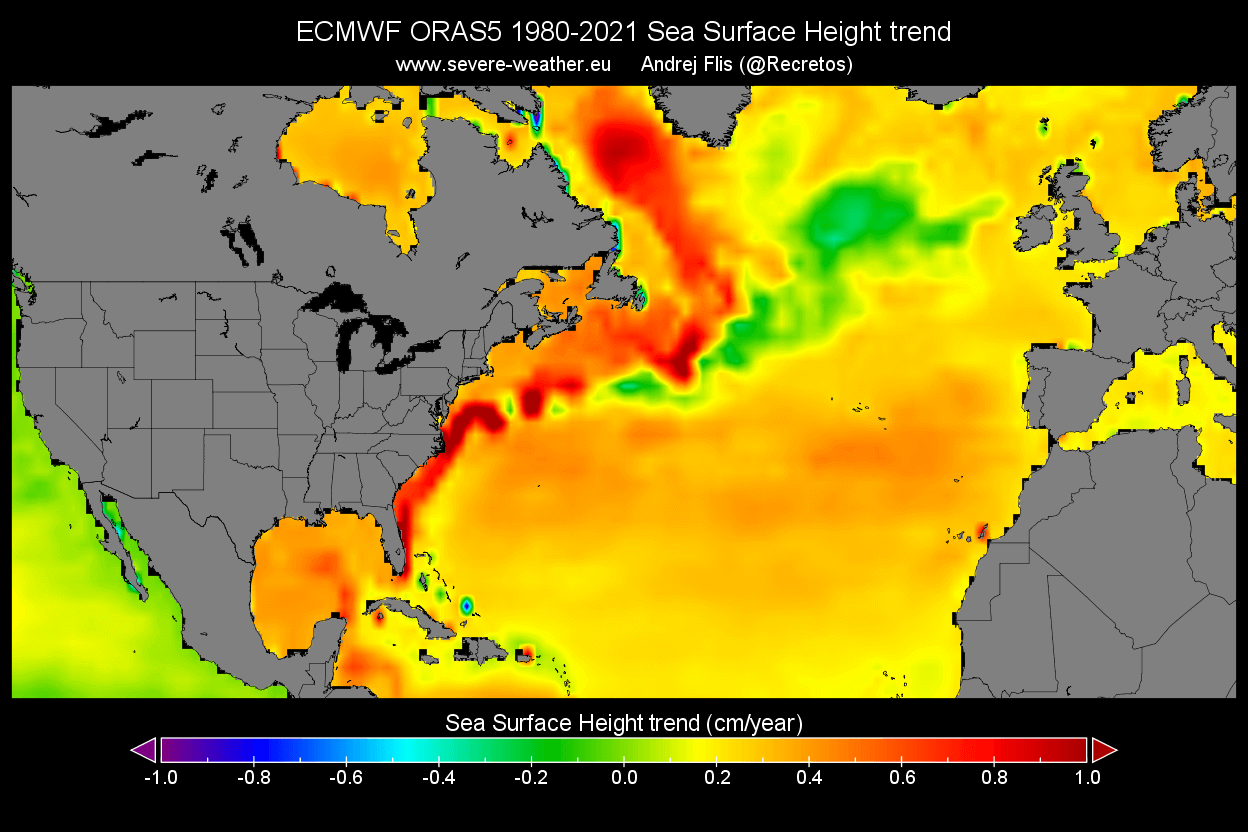
This means less warm water is actively transported to the North Atlantic, as it stalls just off the east coast of the United States. You can see that in the image below, showing the sea surface height trends as the Gulf Stream slows down. You can see the Gulf Stream height increasing as it slows down and piles up.
This increases the storm surge potential and provides more fuel for the storms. For Europe, it can mean a change in the track and strength of low-pressure systems coming in from the North Atlantic.
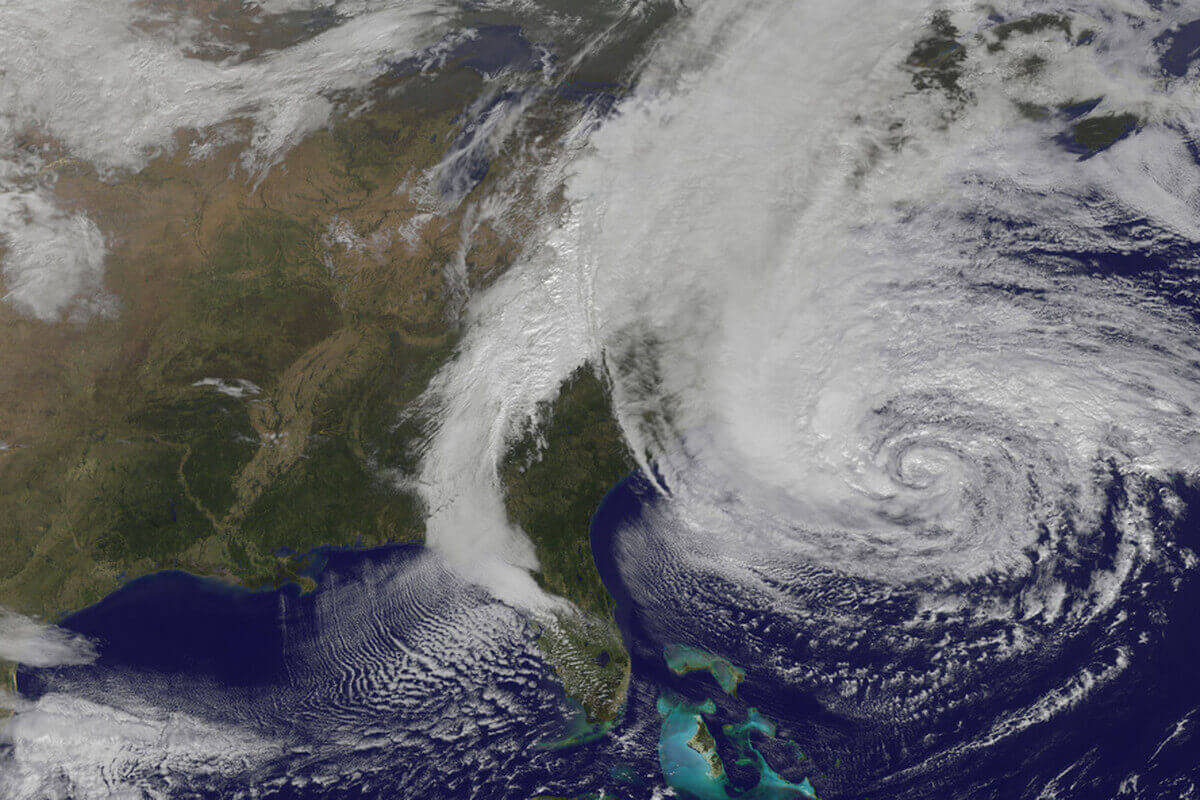
A somewhat recent example of this process was the infamous Hurricane Sandy in 2012. Below is a NOAA-GOES satellite image of Hurricane Sandy as it was sitting over the warm Gulf Stream, using it to power up before landfall in the United States and bringing along a devastating storm surge.
These effects are connected to the changes in the ocean currents, and do have an immediate effect. So, it’s not just the cooling or a new ice age that can result from these changes, but we already feel the immediate effects of the changes in ocean currents.
Based on the amount of freshwater induced by the melting ice, we will likely be seeing climate effects still within our lifetime. It is actually hard to argue that some are not happening already, but it is hard to filter them out in a chaotic system like the global climate.
But what can happen almost overnight are strong storms and hurricanes. The Gulf Stream and the ocean currents play an important role in these events, especially for the United States and Europe.
The latest study on the collapse of the Atlantic Ocean currents by René M. van Westen et al.
Physics-based early warning signal shows that AMOC is on a tipping course
We will keep you updated on various global anomalies and weather pattern development, so make sure to bookmark our page. Also, if you have seen this article in the Google App (Discover) feed, click the like button (♥) there to see more of our forecasts and our latest articles on weather and nature in general.
SEE ALSO: