The latest Winter 2024/2025 forecast data trends are warmer with each new run. But we are starting to see signs in the global weather system that a different picture is possible for next season. We found 3 signs that a colder Winter than expected might be developing for 2024/2025.
We can already see how some of the large-scale global factors are developing. Looking at past data, we know how they change seasonally and how they have influenced winter weather in the past.
We are focusing on the winter pressure pattern in the North Atlantic, which determines the weather from the central/eastern United States to Europe. You will first see what that pattern looks like and how it impacts the winter weather, and then we will look at the three factors that can change its development for Winter 2024/2025.
NORTH ATLANTIC WINTER WEATHER PATTERNS
Weather patterns can usually be defined into regions. The most “influential” weather pattern in Winter is usually the North Atlantic Oscillation, or NAO short. It covers and modifies the weather patterns all the way from the United States and Canada to Europe.
We usually hear a whole lot about these “oscillations” every winter. But what are they really, and why are they important? The term oscillation generally indicates that something oscillates, moving back and forth, up or down.
In weather, this “movement” is usually up or down on a specific weather parameter. It can be the rise and fall of atmospheric pressure, temperature, wind direction, etc…
The NAO describes the rise and fall of pressure in the North Atlantic, more specifically between the Greenland/Iceland area and the central North Atlantic/Azores. You can see a perfect example of a positive NAO phase in the image below.
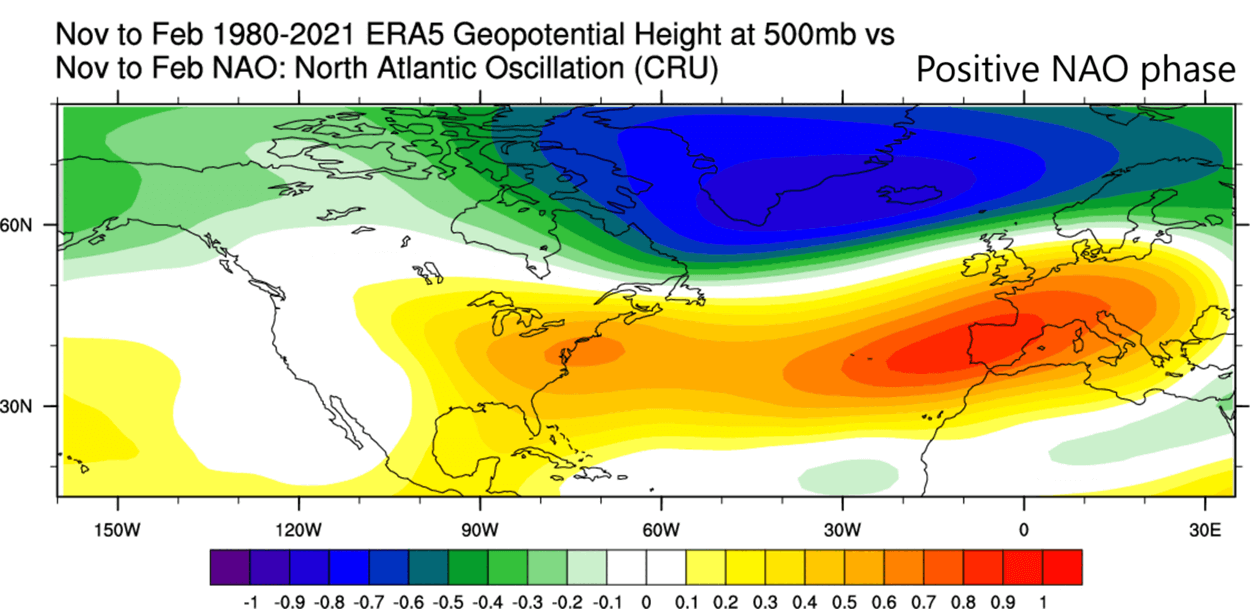
There is low pressure to the north over Greenland and a high-pressure zone below from the U.S. to Europe. In winter, this pattern brings warmer temperatures and less snow to the eastern United States and most of Europe. Overall, this is not what you want to see if you are a fan of snow and winter in the U.S. or Europe.
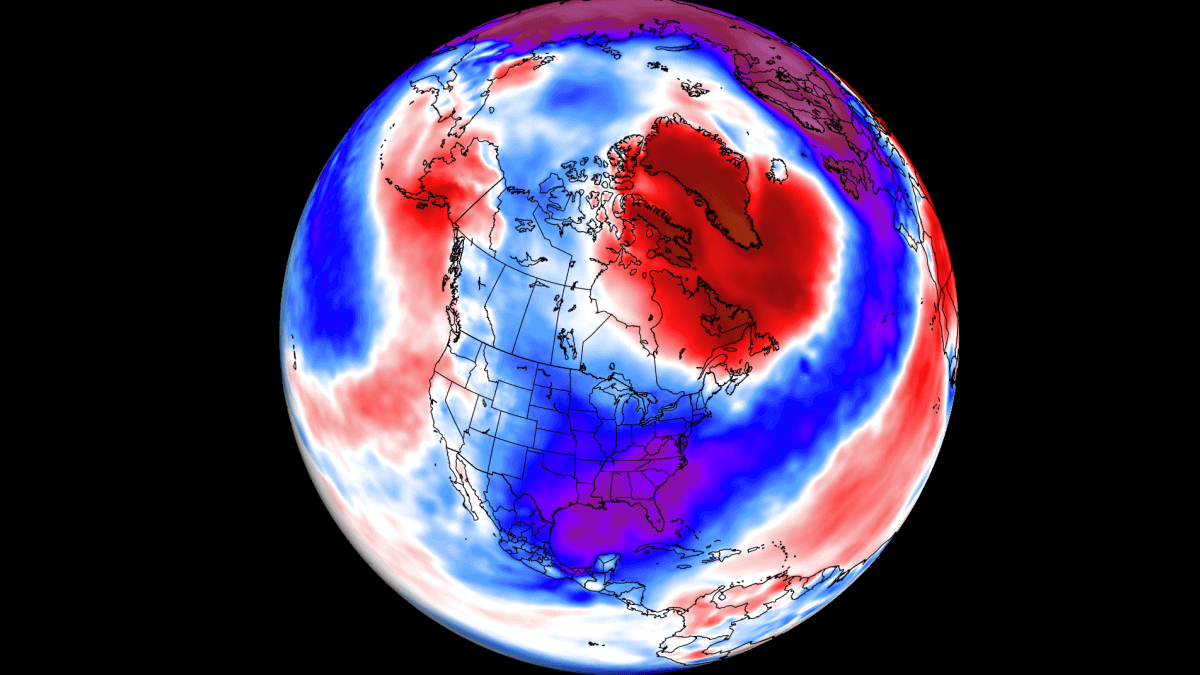
The opposite pattern, a negative NAO, features high-latitude blocking, with a high-pressure anomaly over Greenland and low-pressure from the United States to Europe. The image below shows an example of such a pattern.
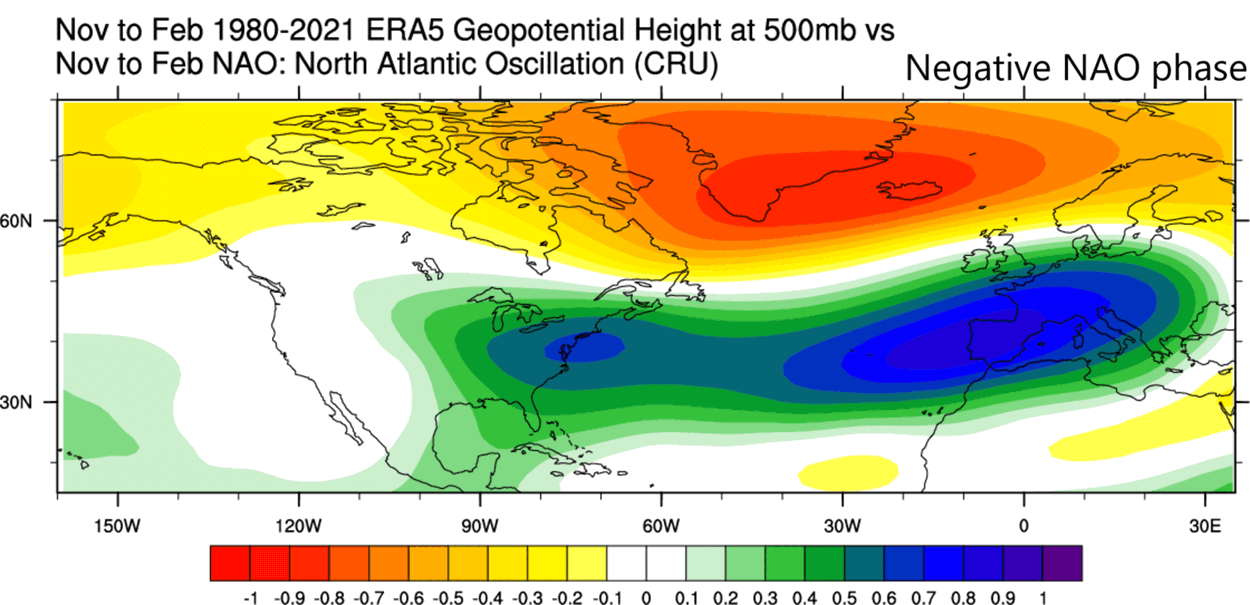
The high-pressure anomaly to the north causes a big disruption in the flow, pushing the polar jet stream further to the south. That enables an easier release of colder air into the central and eastern United States and Europe.
The image below shows the typical temperature pattern for a negative NAO phase. Because high pressure blocks the northern regions, this disrupts the flow and releases colder air across the United States and Europe.
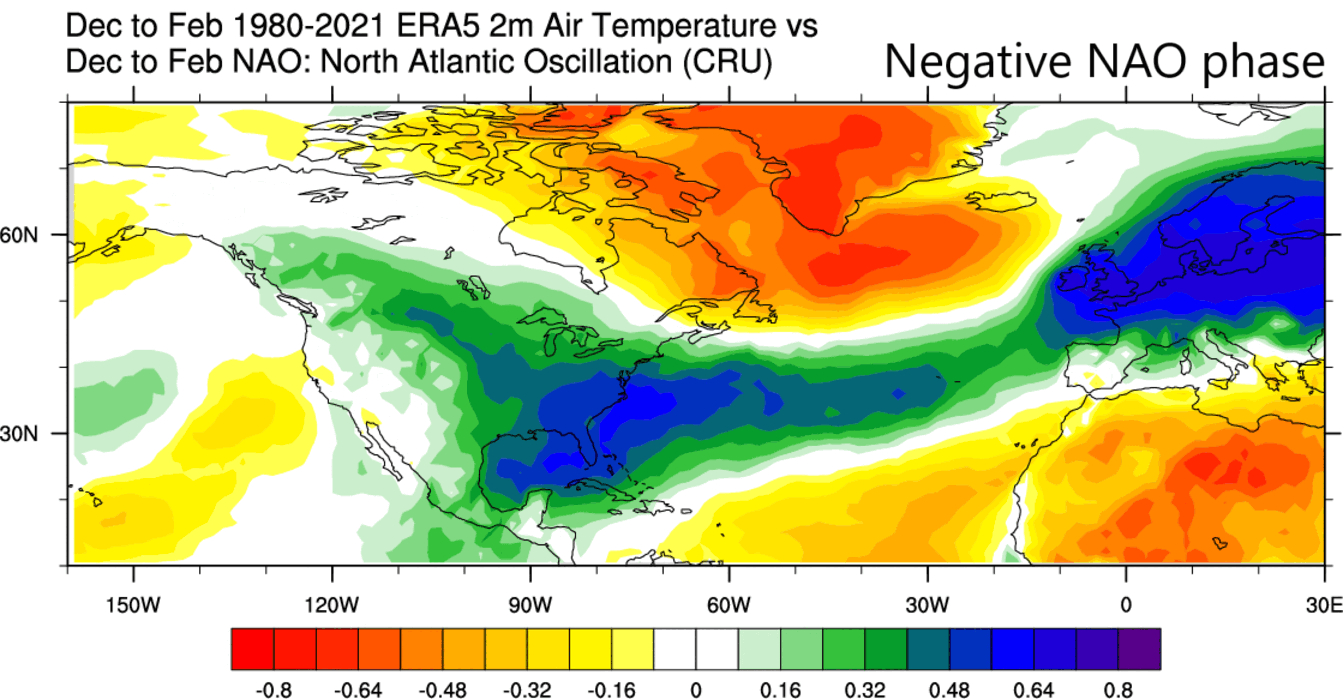
So, to summarize, if you want a good chance for colder weather and snow across the central/eastern United States and Europe, you want to see a negative NAO pattern in the forecasts.
The next image below, by Climate.gov, compares temperature anomalies in two different NAO phases. Both examples are actual winter temperature anomalies from the past. You can see what a big difference the NAO phase can make across a large part of the United States, Canada and Europe.

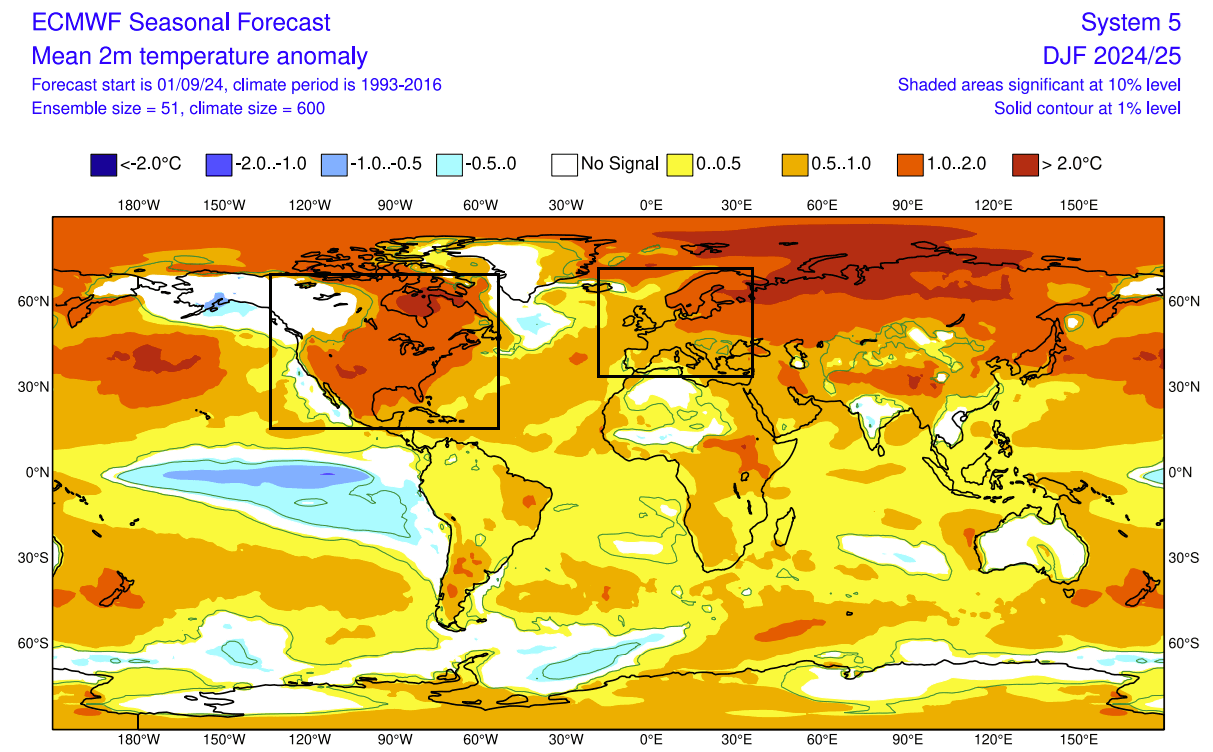
But speaking of the forecasts, the latest ECMWF forecast below, released just a few days ago, calls for a strong positive NAO over Winter 2024/2025. You can see the low-pressure anomaly over Greenland and high-pressure over the United States, the Atlantic, and Europe.

The temperature forecast from the same model also shows a typical positive NAO pattern: a warmer winter than normal over much of the United States and Europe. This is because a positive NAO helps to lock the colder air into the northern regions.
So, if these forecasts show that we are in for an abnormally warm winter, then it’s all said and done? Not even close. Especially not in September, three months before the actual winter starts.
Weather forecasts for the long term improve each year but are not perfect. As global weather runs on a certain set of physics rules, we can look at past years and seasons and search for overall global similarities with the current year/season.
We are currently monitoring three weather factors that, contrary to the mainstream forecast, actually show a signal for a negative NAO phase for Winter 2024/2025.
A LA NINA WINTER
The first factor is the ENSO, which stands for “El Niño Southern Oscillation”. ENSO is a region of the equatorial Pacific Ocean that changes between warm and cold phases. Typically there is a phase change around every 1-3 years.
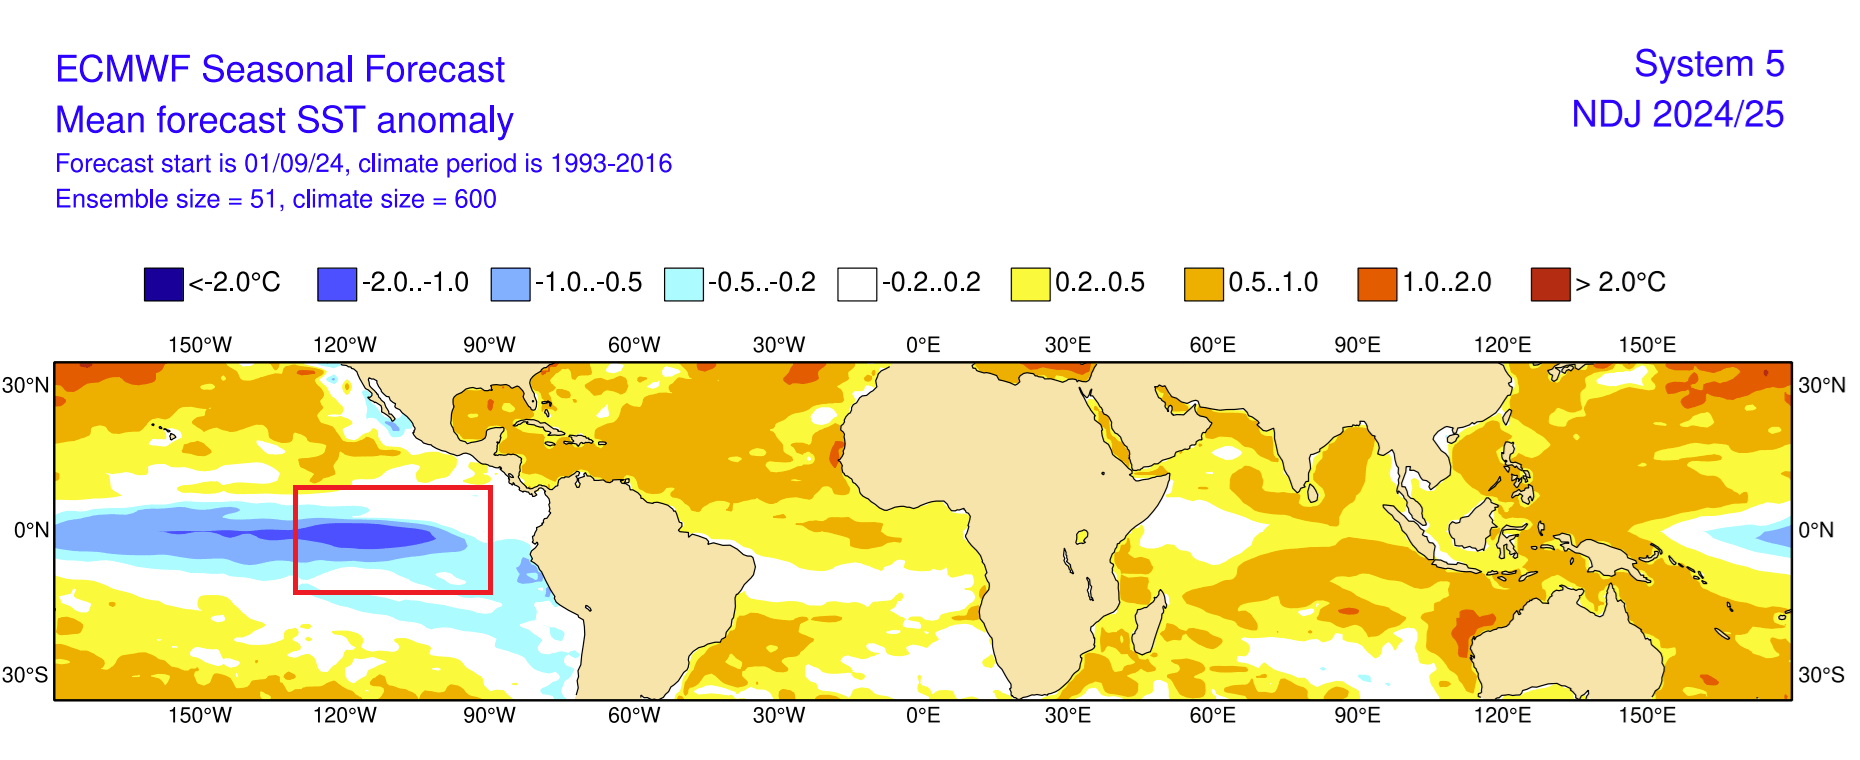
Currently, we are observing a cold phase of the ENSO starting to emerge, called the La Niña. You can see it below in the latest ocean anomaly analysis. It shows colder-than-normal surface waters in the central and eastern ENSO regions starting to develop.

ENSO phases significantly influence tropical rainfall, pressure patterns, and the complex dynamics between the ocean and the atmosphere. The image below shows the circulation pattern of a cold phase, which is currently developing.

Changing the circulation, ENSO significantly impacts tropical rainfall and pressure patterns, altering the atmosphere-ocean feedback system. This feedback system spreads the ENSO influence globally, especially the Winter temperature and snowfall patterns.
Below is an ECMWF forecast image showing the long-range outlook of the central ENSO region. A weak La Niña is forecast to develop and last over the Fall and Winter. A weakening of the La Niña is expected early next year, with a shift to a neutral phase.

To better understand the ENSO changes, we produced a high-resolution video animation that shows how the ocean temperatures went from warm to cold anomalies across the ENSO regions in the tropical Pacific.
A La Niña event is not something new, as we actually had 3 La Niña winters in the past 4 years. So what makes it special to see it as a potential cold air factor? It is the location. A La Niña can either be based in the eastern or central Pacific, giving it a rather different character.
A DOUBLE WEATHER CHARACTER
As mentioned, a La Niña can be based in the eastern or central Pacific. Different factors determine where this event will occur, and for that reason, its expected winter weather influence is also different.
The image below shows two different types of La Niña. On top we have the eastern Pacific or EP La Niña, and on the bottom we have the central Pacific or CP La Niña. The image is from a study by Zhang, W., Wang, L., Xiang, B. et al.

Looking at the actual ocean forecast, you can see that a very clear eastern Pacific (EP) La Niña is developing. It is perhaps situated even more to the east than in the example above. Funny enough, this forecast is from the same model above that showed a strong positive NAO mode and a warm winter. But let’s go further.
The image below shows a graph from a study that directly compared the differences between different types of La Niña events. It shows the NAO phase from November to May for both types. You can see that the eastern Pacific (EP) La Niña has a clear signal for a negative NAO, especially in January and February.
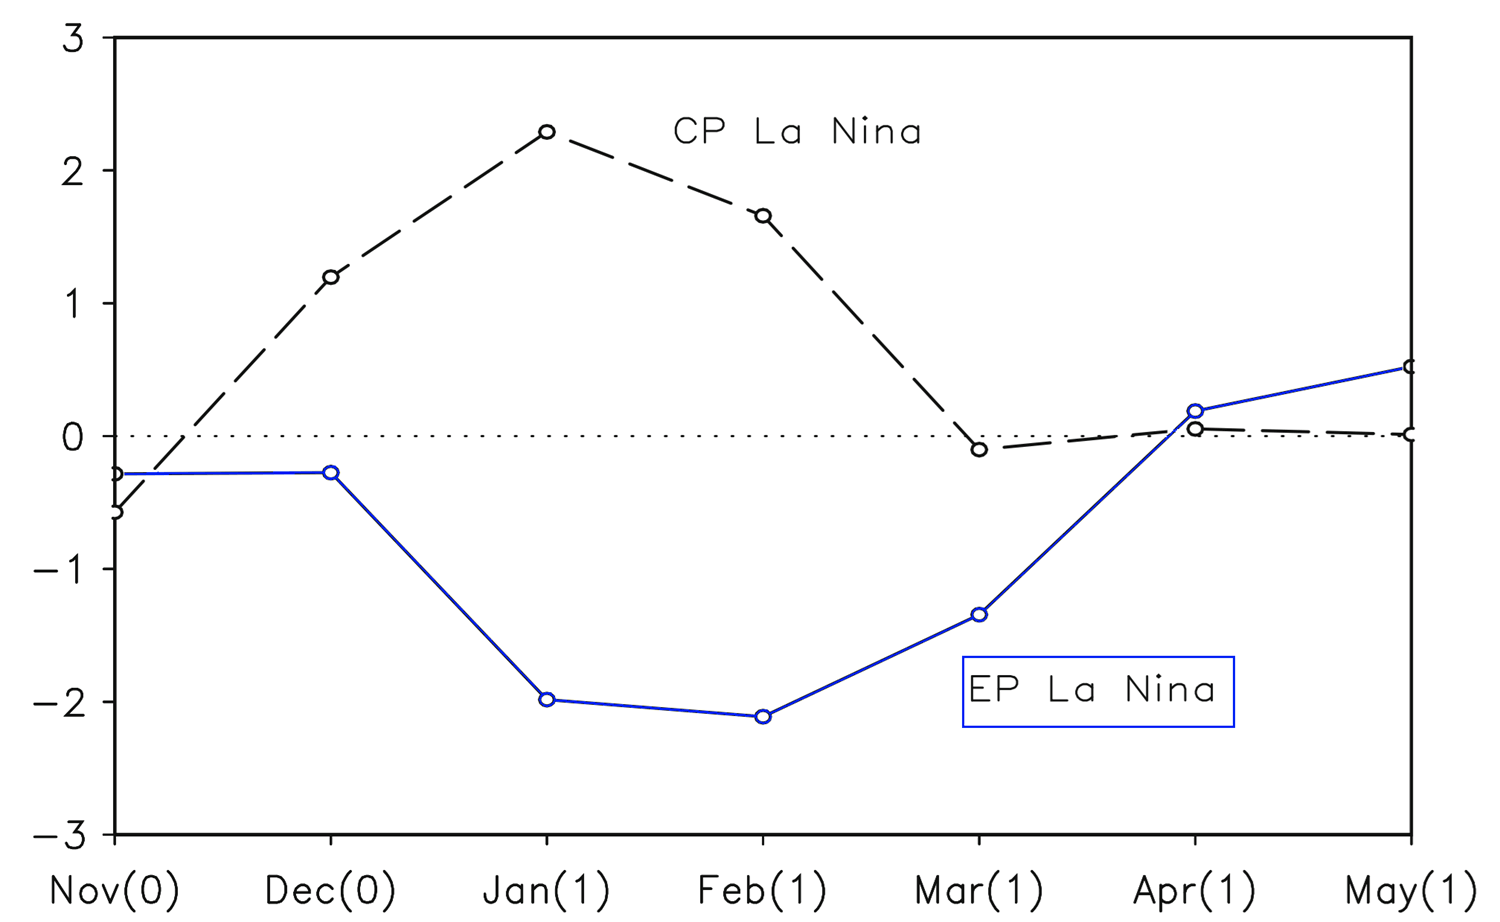
As we already know, the negative NAO means a high-pressure system over Greenland and a disturbance in the jet stream. This creates conditions for a potentially colder-than-normal winter over the central/eastern United States and Europe.
The image below shows the jet stream difference between the two types of La Niña events. On the top (a) is the jet stream in an EP La Niña, and on the bottom is the CP La Niña. You can see a very different picture, with the jet stream being deformed in an EP La Niña due to the high pressure over Greenland and a negative NAO.
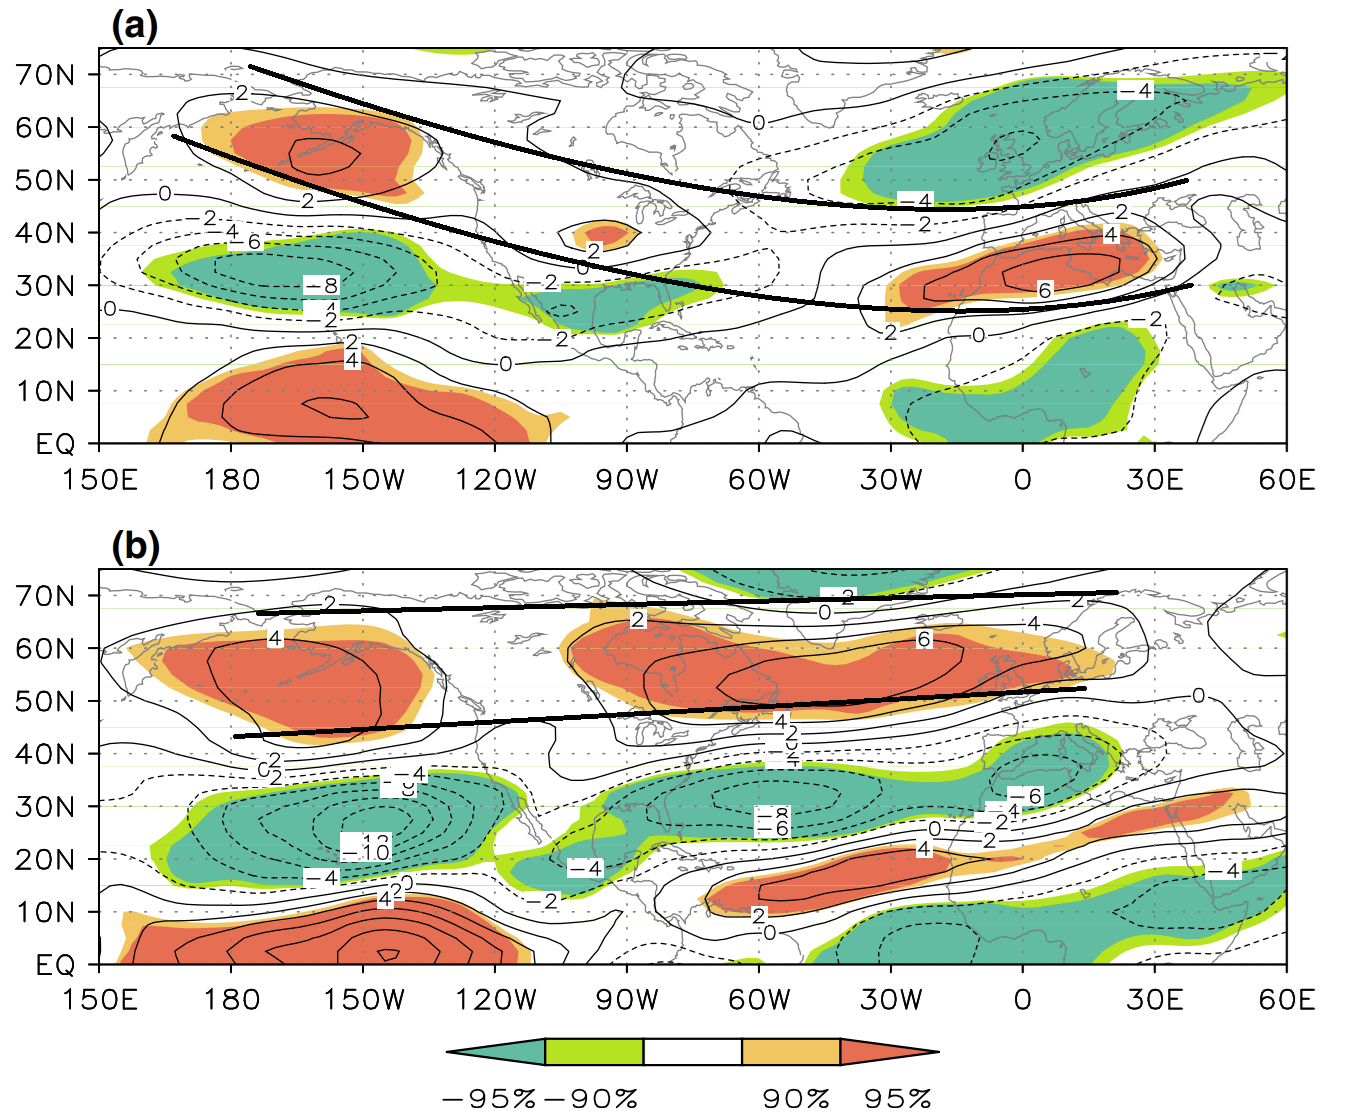
The jet stream is being diverted more to the south in an EP La Niña, which brings along lower pressure anomalies and an open path for colder air into the United States and Europe.
Our next factor is also in the Ocean and very close to the NAO area itself. Its the Atlantic Meridional Mode (AMM).
WARM ATLANTIC, COLD WINTER?
One would expect that if an ocean anomaly in the Pacific has such an important role, then the Atlantic anomalies are no less significant. And that is true, but they usually have a different role and mechanics.
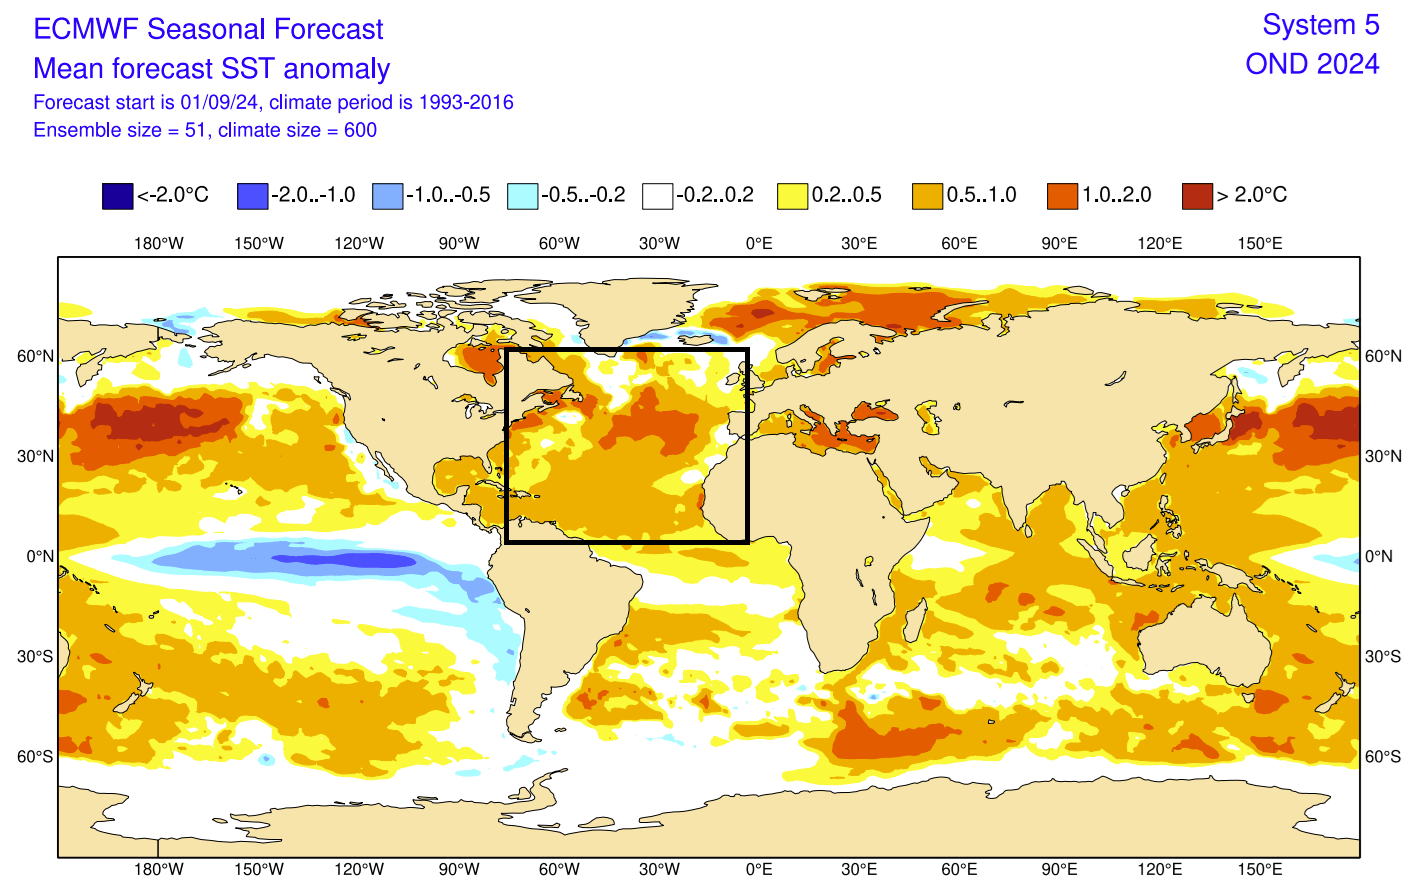
The area we are looking at is the North Atlantic, more specifically the Atlantic Meridional Mode or AMM. It’s basically an area of the North Atlantic that also features warm and cold phases. The image below shows the typical positive AMM pattern, with warm ocean anomalies in the North Atlantic.

It is interesting to see that there is also a cold signal in the tropical Pacific, that looks like a weak La Niña pattern. That is probably not a coincidence, as these patterns and anomalies do like to work in tandem, driven by the same background processes.
Below is the ocean forecast from the ECMWF, where we can see the warm anomalies forecast in the same area and, of course, the La Niña. This is consistent with a positive AMM mode, as you can see in the example above.
Looking at past data below for positive AMM, you can see a known pressure pattern. It is a negative NAO phase, with the high-pressure blocking over Greenland/Iceland and a low-pressure tendency over the United States and Europe.
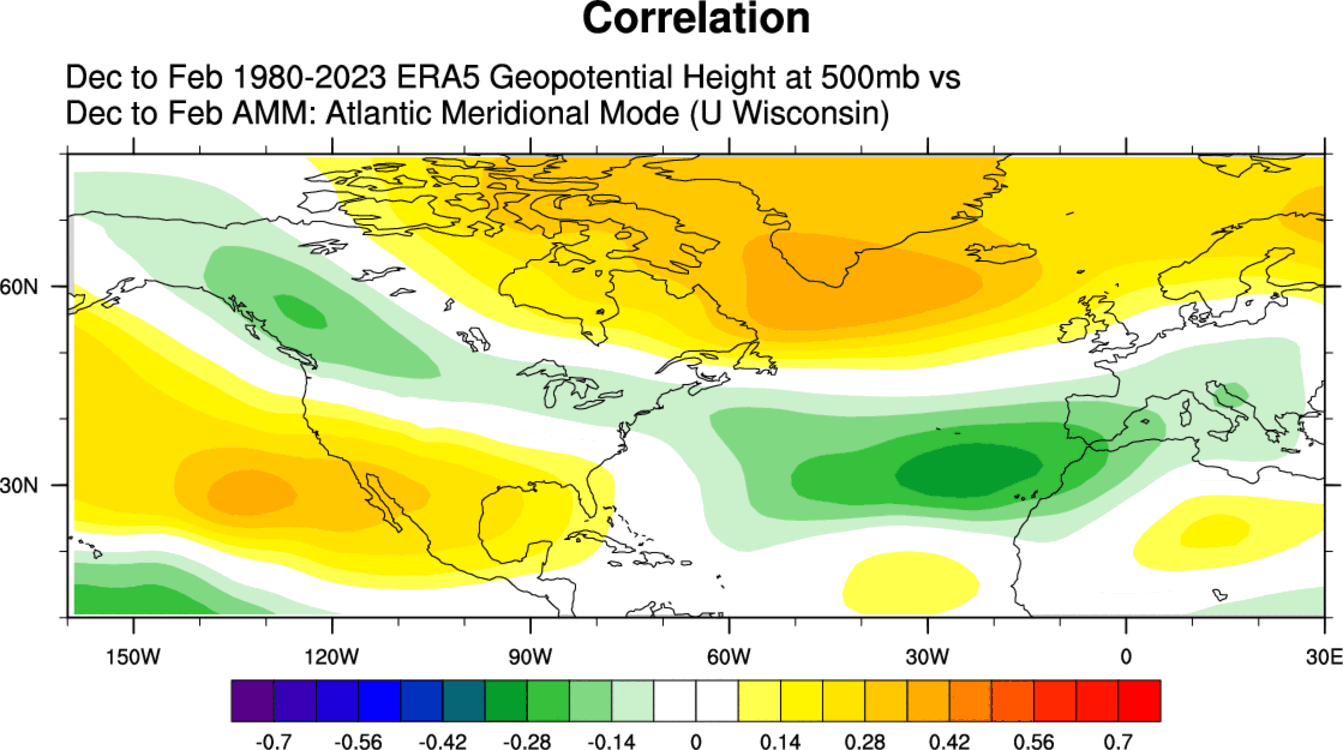
This is another sign that goes in favor of the negative NAO despite the forecast going for a warmer winter.
But the third sign that something might be off with the forecast, is not in the ocean, but in the atmosphere. And it does play along with both of the previous two factors.
ATMOSPHERIC WIND PHASE
Like in the ocean, we again have a region that alternates between a positive and a negative phase. But instead of temperatures, we are now dealing with winds or rather their direction. This is called the Quasi-Biannial Oscillation, or simply QBO.
The QBO is a regular variation of the winds high above the equator in the Stratosphere, alternating between easterly and westerly (zonal) winds. Strong winds in the stratosphere travel in a belt around the planet at the equator. And around every 17 months, these winds completely change direction.
Below is an image showing the westerly wind anomalies over the Equator in the stratosphere for the past 40 years. Negative values mean the wind was easterly, and positive values show the wind was westerly. It nicely shows just how regularly this wind shifts, just like watching the heartbeat of the atmosphere.
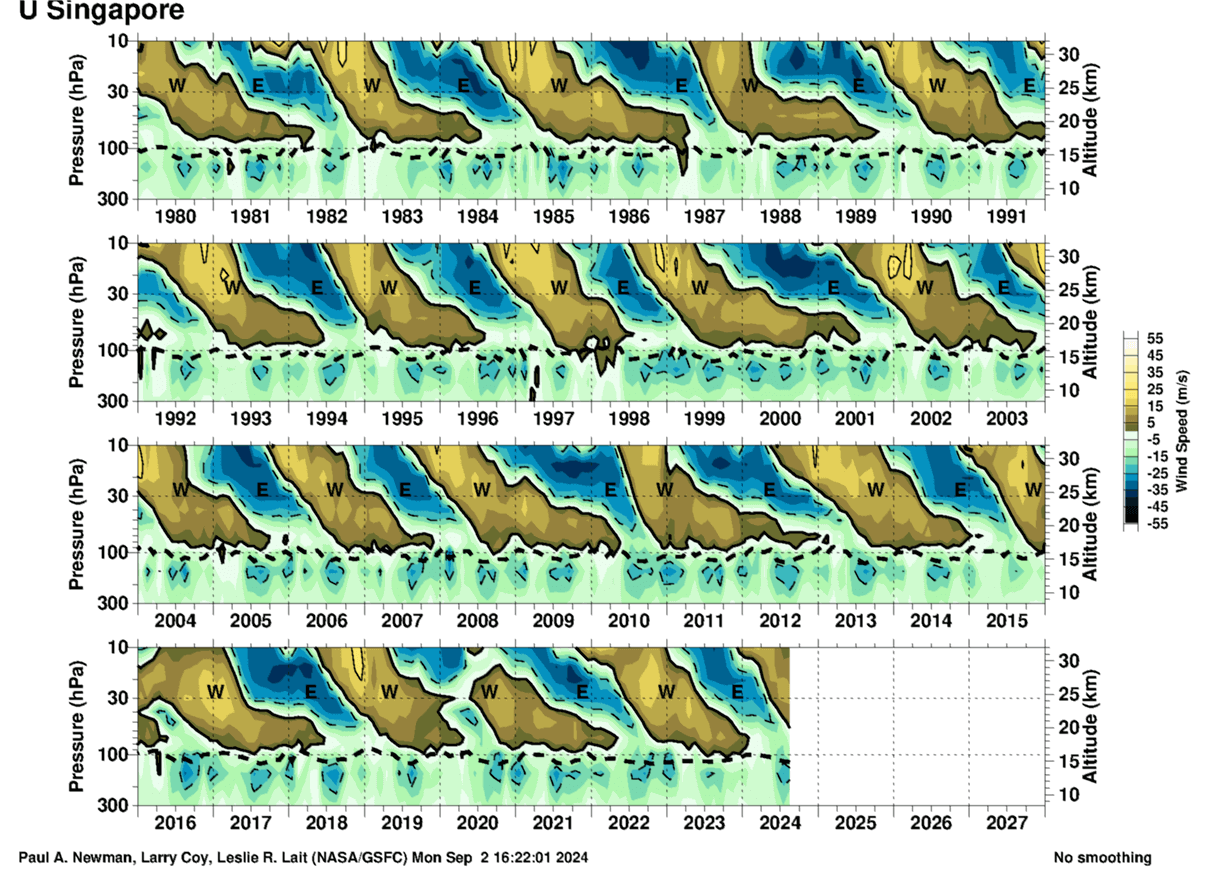
Looking more closely at the past 3 years, we can see how each phase descended over time. A negative/easterly phase was active in 2021/22, and a westerly in 2022/23. It was followed by another negative QBO phase last winter. Currently, a new westerly phase is descending from above. The image below is from NASA analysis.
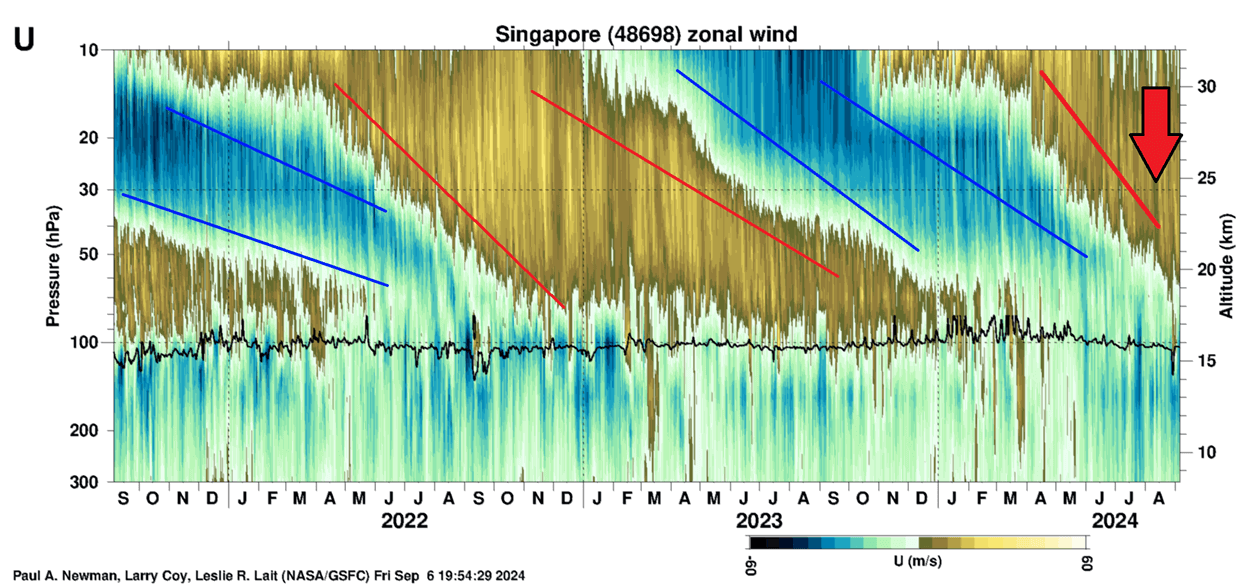
A radiosonde analysis from Singapore also shows the wind direction above the tropics. It reveals the westerly winds around the 10-70mb level in the stratosphere, confirming that the west QBO phase is active. It is in the early stages and will continue to strengthen as it further descends.

There is more than one reason why/how QBO can influence our Winter weather. One very important aspect is, of course, the polar vortex. The image below shows the connection between the QBO and the polar vortex in the December-January winter period.

It might seem complicated, but it’s not. The main takeaway is that the QBO is deeply connected to the atmospheric motion and helps with the overall tropical forcing, including the La Niña. You could say that it also helps with the “communication” between the oceans and the Polar Vortex.
That is why one QBO phase does not mean a fixed weather situation, as a west QBO response can be different during a La Niña or an El Niño. So, we must look at the global weather system as a whole.
Below is an analysis of the winter pressure pattern during La Niña years, with the QBO going from easterly to westerly, just like this year. Again, we can see a very clear negative NAO pattern, with a high-pressure area over Greenland and a low-pressure area over North America and Europe.
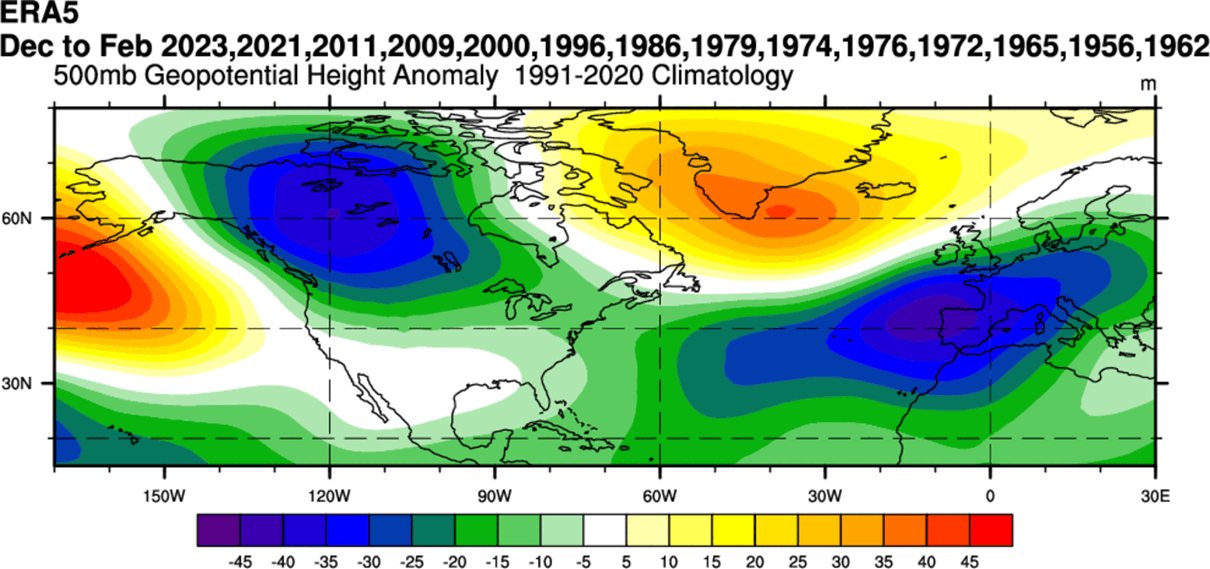
You can notice a lot of “older” winters in this mix of data, which tends to impact the temperature analysis below. Overall, there is a colder anomaly over the United States, Canada, and Europe. But many of these winters are several decades old and, of course, colder by default compared to the modern norm.
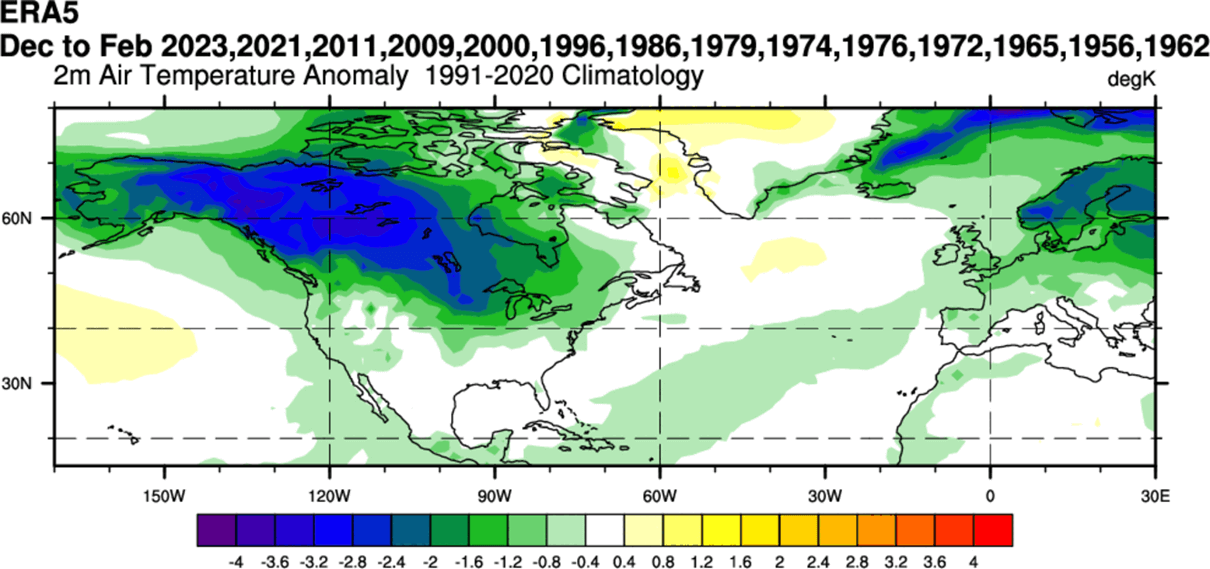
Still, these anomalies show what this combination means for winter patterns, and they clearly indicate a negative NAO pattern.
SUMMARY AND THOUGHTS
We have now seen 3 different factors all indicating a potential negative NAO pattern in winter 2024/2025. That would mean good potential for some winter weather across parts of the central and eastern United States and Europe.
Of course, the negative NAO does not guarantee cold and snow, as it also has its own variations, but it sure does make it easier to bring winter into your backyard.
At this point, a question also arises: If the ECMWF model above forecasts an eastern Pacific La Niña and a warm Atlantic, why doesn’t it see all this and forecast a negative NAO and a colder winter instead of a blow torch for 2024/2025?
The answer could be that the model is just not perfect or even plain wrong. But given the level of advancement in weather predictions, that’s probably not the best assumption.
It’s also worth noting that the forecast period we are looking at is 3-6 months in the future, so it’s likely that the model just needs more time to align and adjust its prediction properly. This is also the first time this model has shown a proper EP La Niña developing, so it will be interesting to see further adjustments in the next runs.
To show you just how good (or bad) a model forecast can be, below is the same forecast for the past winter (23/24), issued in October. It showed a low-pressure area over much of the United States and the North Atlantic. It also had the main high-pressure area over western Canada and Europe.

Below is the actual pressure pattern for last winter. You can see a fairly different look, with the main high-pressure area over southeastern Canada. There was no large low-pressure anomaly over the United States, and the Atlantic low-pressure area was situated over northern Europe.
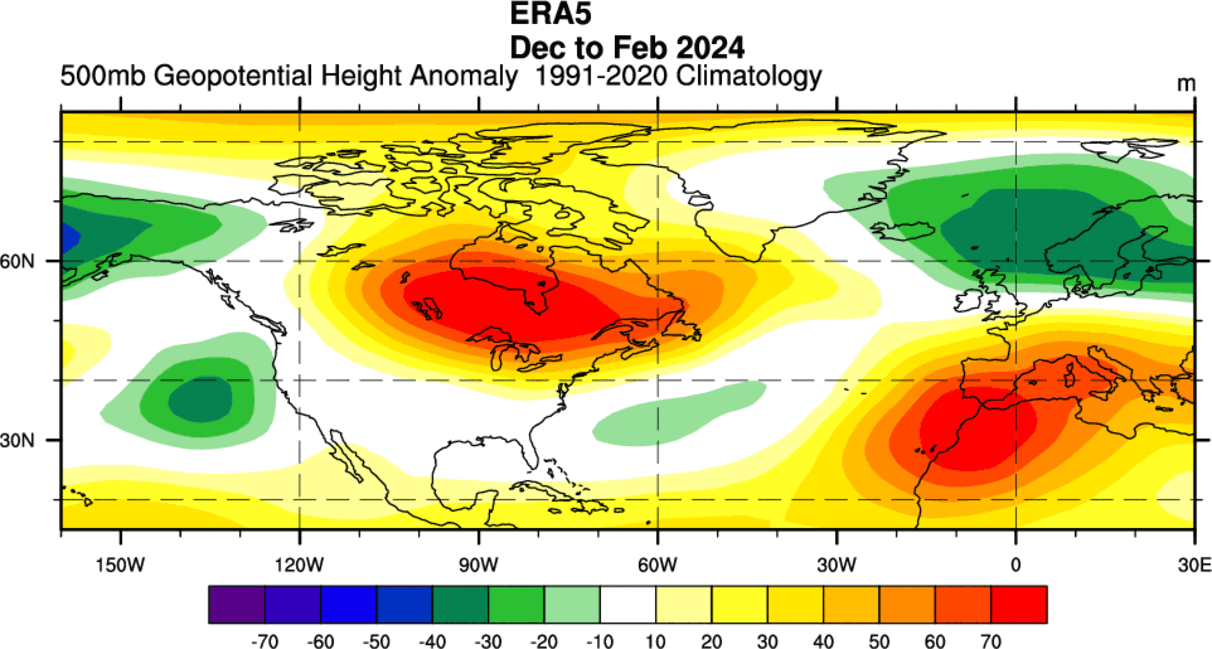
This just shows that models do make adjustments, and as you can see in the example above, they can change their minds when they start to see the global weather development properly.
At this point last year, the ECMWF had a fairly good idea about the ocean anomalies for winter but still moved around quite a bit in the forecast. That also shows that not every year is the same, and not every year the same factor will have the same effect.
For that reason, we constantly monitor the latest global weather patterns and their development. We are always trying to find signs and links to past weather patterns with it, a glimpse of the future.
We will keep you updated on the global weather pattern development, so bookmark our page. Also, if you have seen this article in the Google App (Discover) feed, click the like button (♥) there to see more of our forecasts and our latest articles on weather and nature in general.
Dont miss: Winter Forecast 2024/2025: First long-range Predictions from Seasonal Weather models