The Polar Vortex is breaking down weeks ahead of schedule. Stratospheric winds are dropping to near zero and are forecast to reverse in the coming days, making this the earliest Sudden Stratospheric Warming (SSW) on record. With no such event in the observed record, I searched climate model simulations for winters where the same thing happened during a strong El Niño.
The winters I found show a clear cold and snowy signal for parts of the United States, Canada, and Europe in December and January, while the Super El Niño is trying to push a very different pattern. Below, I look at both and see if the latest forecasts already show any trace of the SSW impacts in the atmosphere.
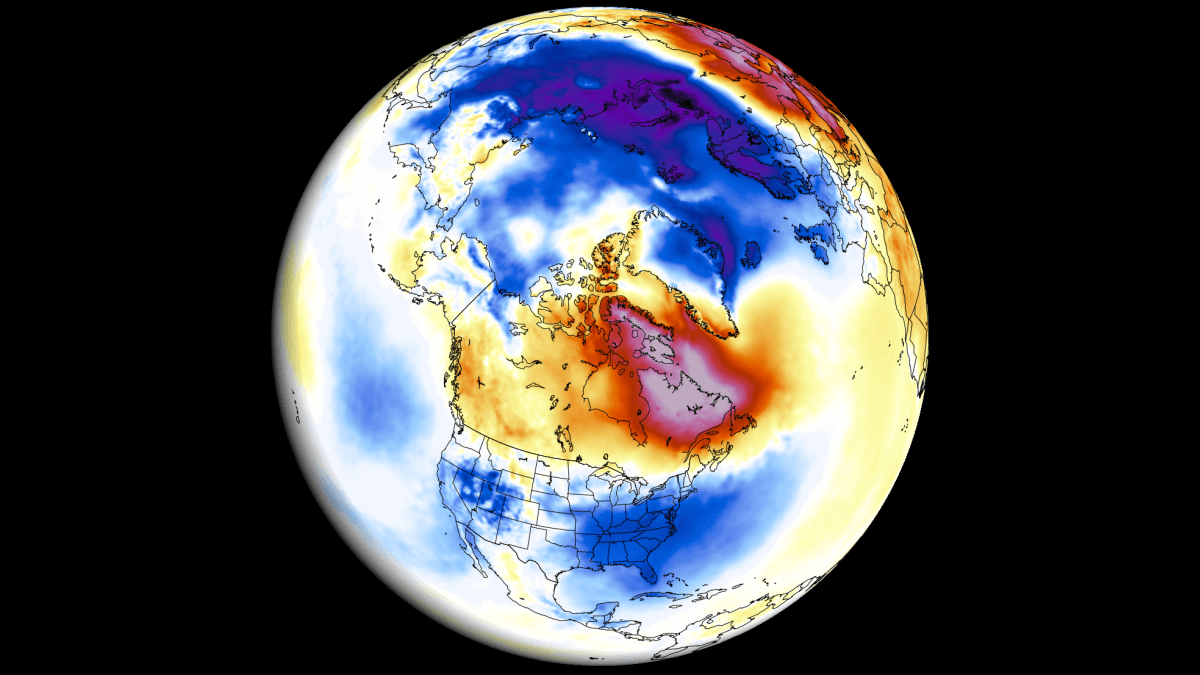
Polar Vortex: Winter Engine Over the North
The Polar Vortex is a broad winter circulation over the northern (and southern) hemispheres. You can imagine the Polar Vortex as a spinning wall over the polar regions, rising from the surface into the stratosphere (over 50 km/31 miles high), trapping the cold polar air inside.
This whole winter circulation is divided into two layers: the stratosphere (at higher altitudes) and the troposphere (at lower altitudes). A strong, stable Polar Vortex acts like a barrier, locking the coldest air over the North Pole and creating milder conditions for the United States and Europe, but it can be disrupted and release that cold.
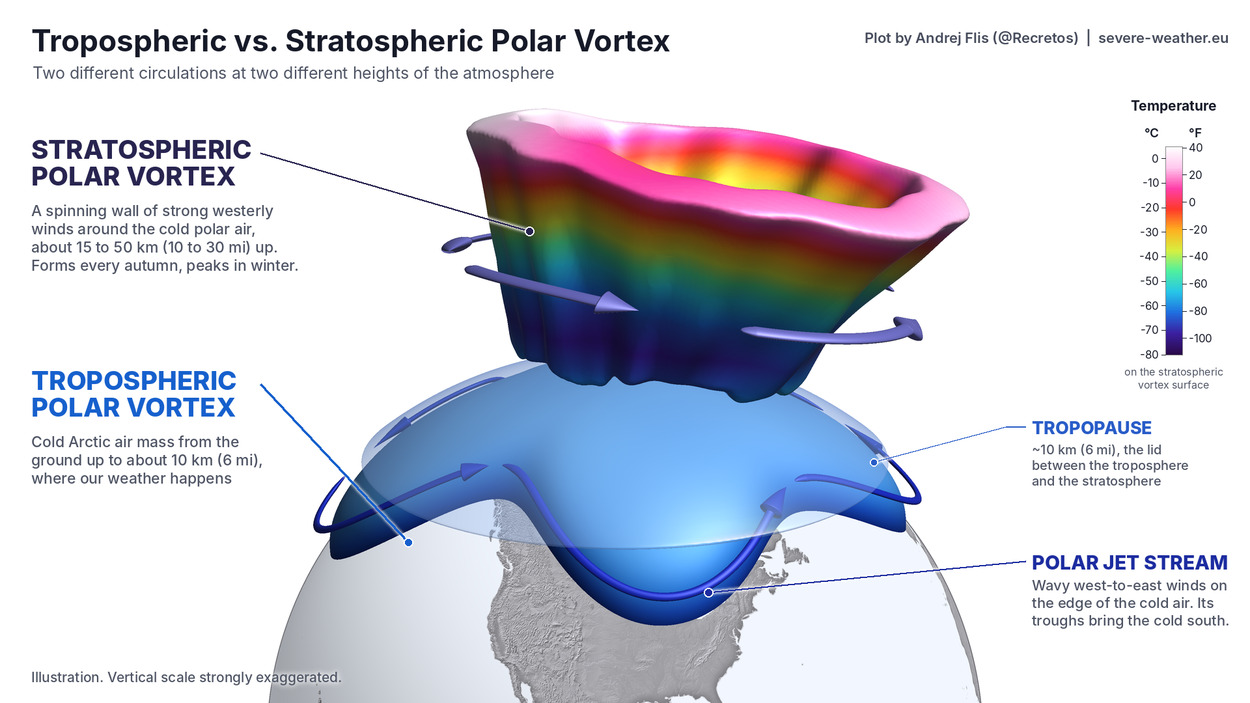
The main disruption usually arises from a rise in pressure and temperature in the stratosphere, known as a Sudden Stratospheric Warming (SSW) event, or from other dynamics that can originate from the lower levels.
Below is a 3D look at the Polar Vortex for today, and you can clearly see its actual structure. But unlike the example image above, you can see that this is a very disrupted Polar Vortex, because we are currently in the middle of a record-early Polar Vortex disruption, with the stratospheric wind reversal expected in the coming days.
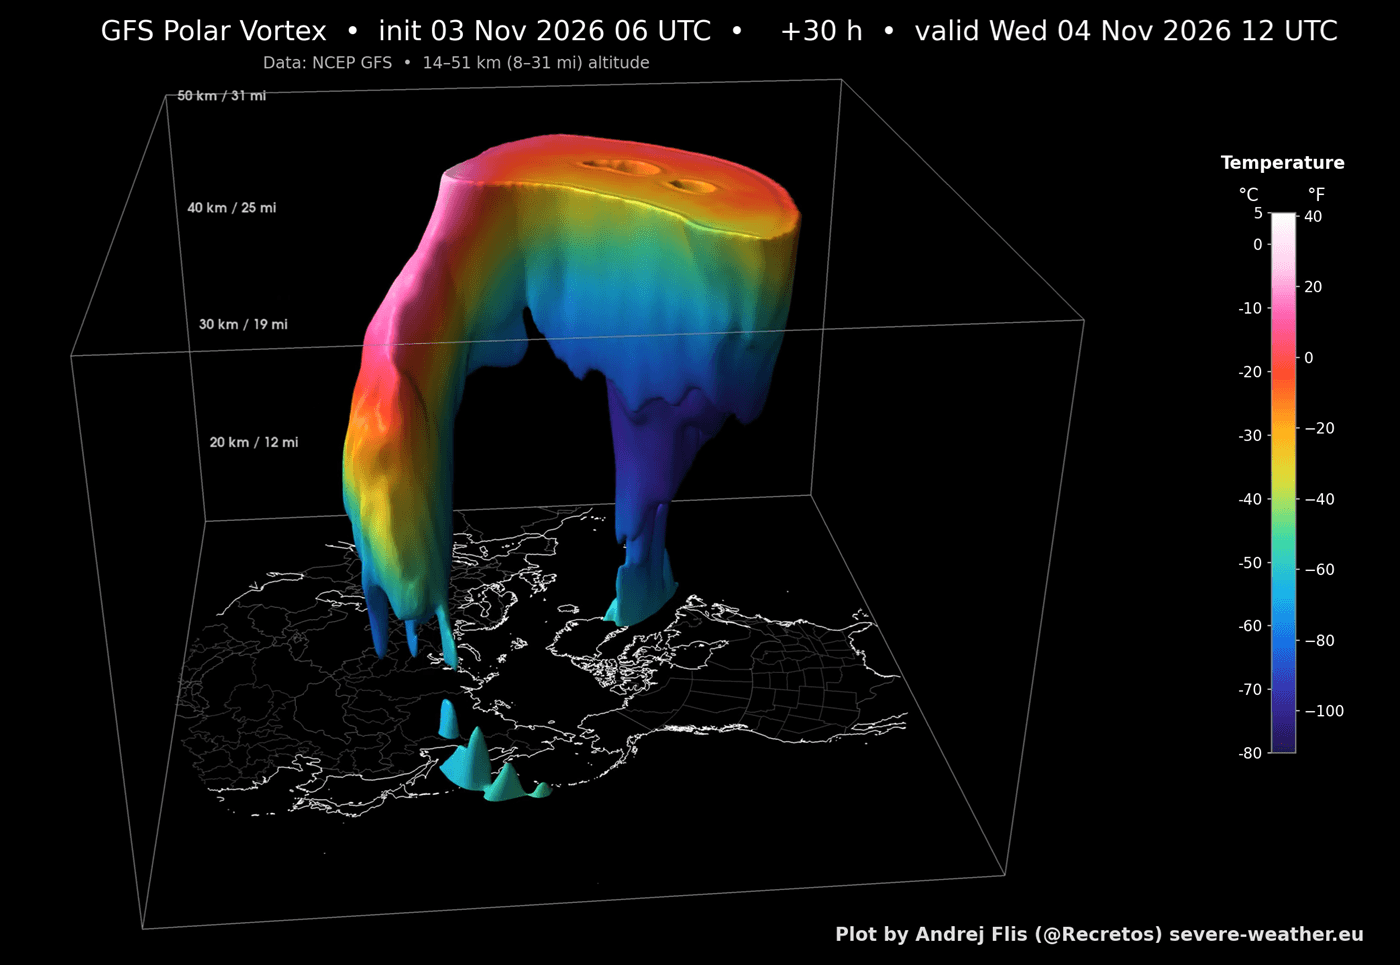
I decided to also share the full 3D Polar Vortex forecast video below. It nicely shows the real disruption dynamics and how it deforms and splits the Polar Vortex core area in a Stratospheric Warming event.
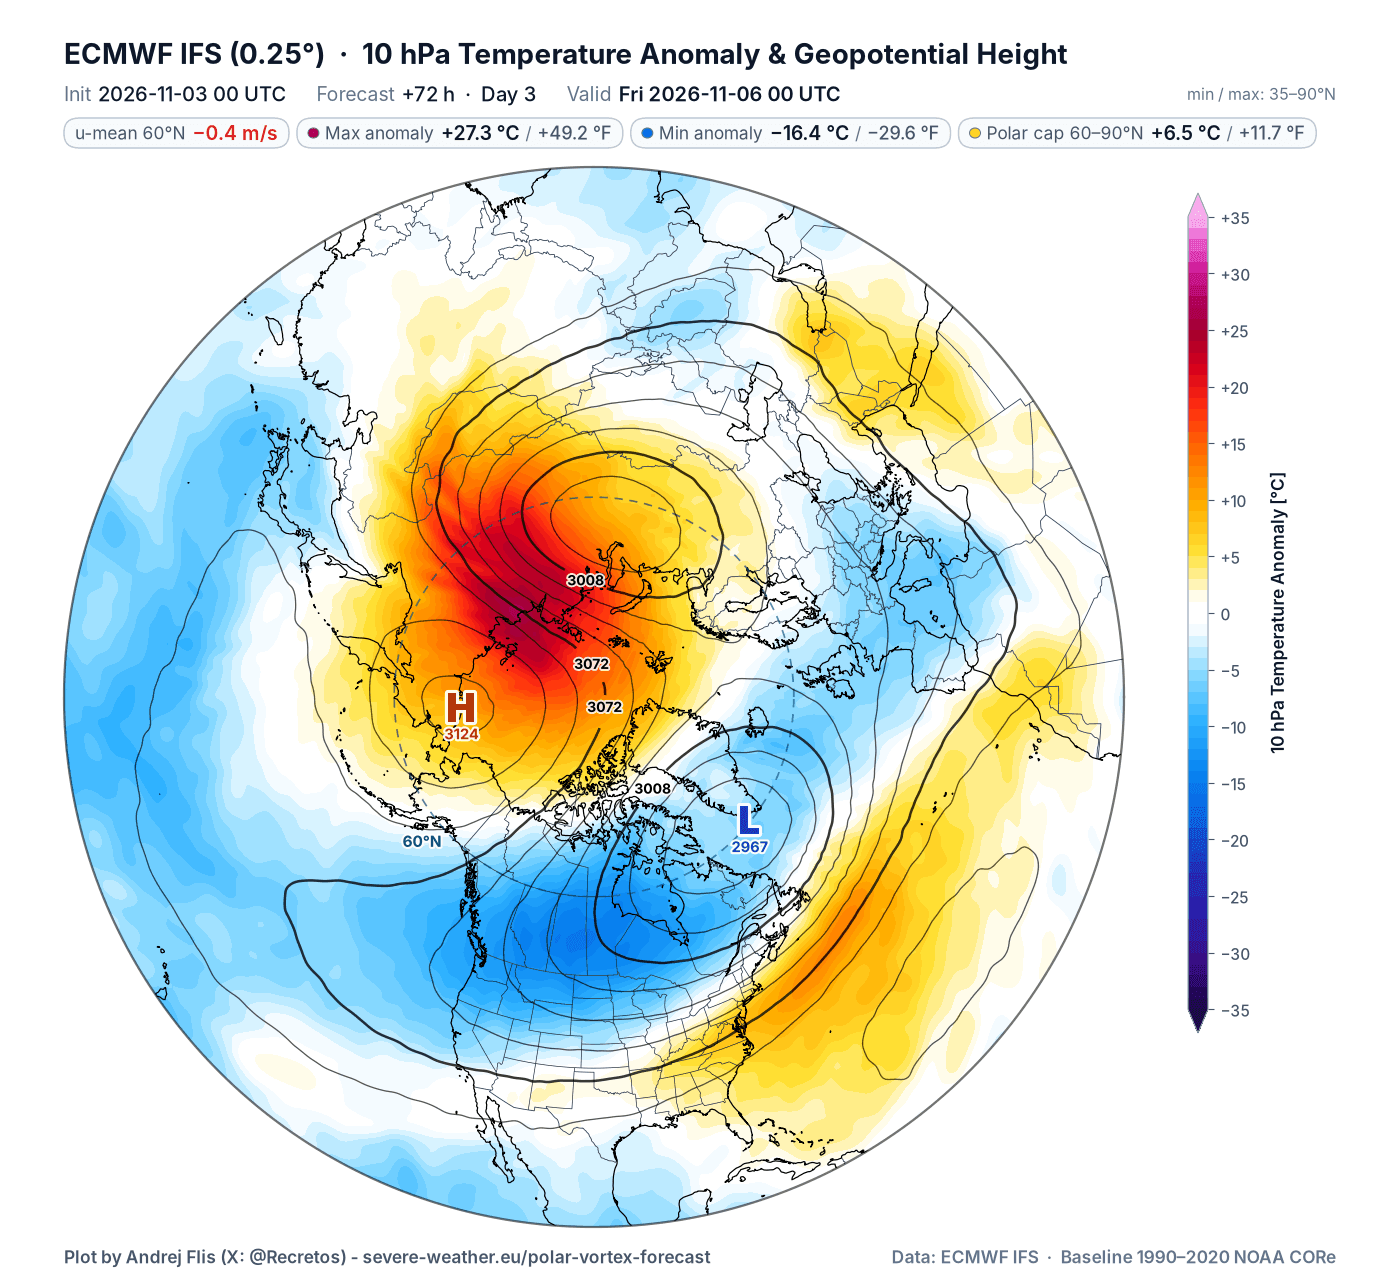
The whole event is nicely seen in the forecast image below for 10mb level (30 km – 19 miles), which shows the split of the Polar Vortex into two cores. This is the forecast for Friday, when the wind reversal in the stratosphere is expected. You can also see the temperature compared to normal, with the temperatures in the stratosphere rising over +27°C (49°F) above normal for this time of year.
We usually monitor the overall progress and strength of the Polar Vortex by just looking at its wind in the stratosphere. A strong positive (westerly) wind indicates stable conditions or a strong Polar Vortex, but weak or even negative (easterly) winds indicate a complete reversal and a breakdown of the Polar Vortex.
Below is the latest analysis and forecast of the mid-stratospheric winds around the Polar Vortex. It shows a strong slowdown, well below normal, and also well below the previous record low strength for this time of year. We can see the projected wind reversal forecast for Friday, when the stratospheric winds first drop to zero, and a potential new reversal next week (still the same event).
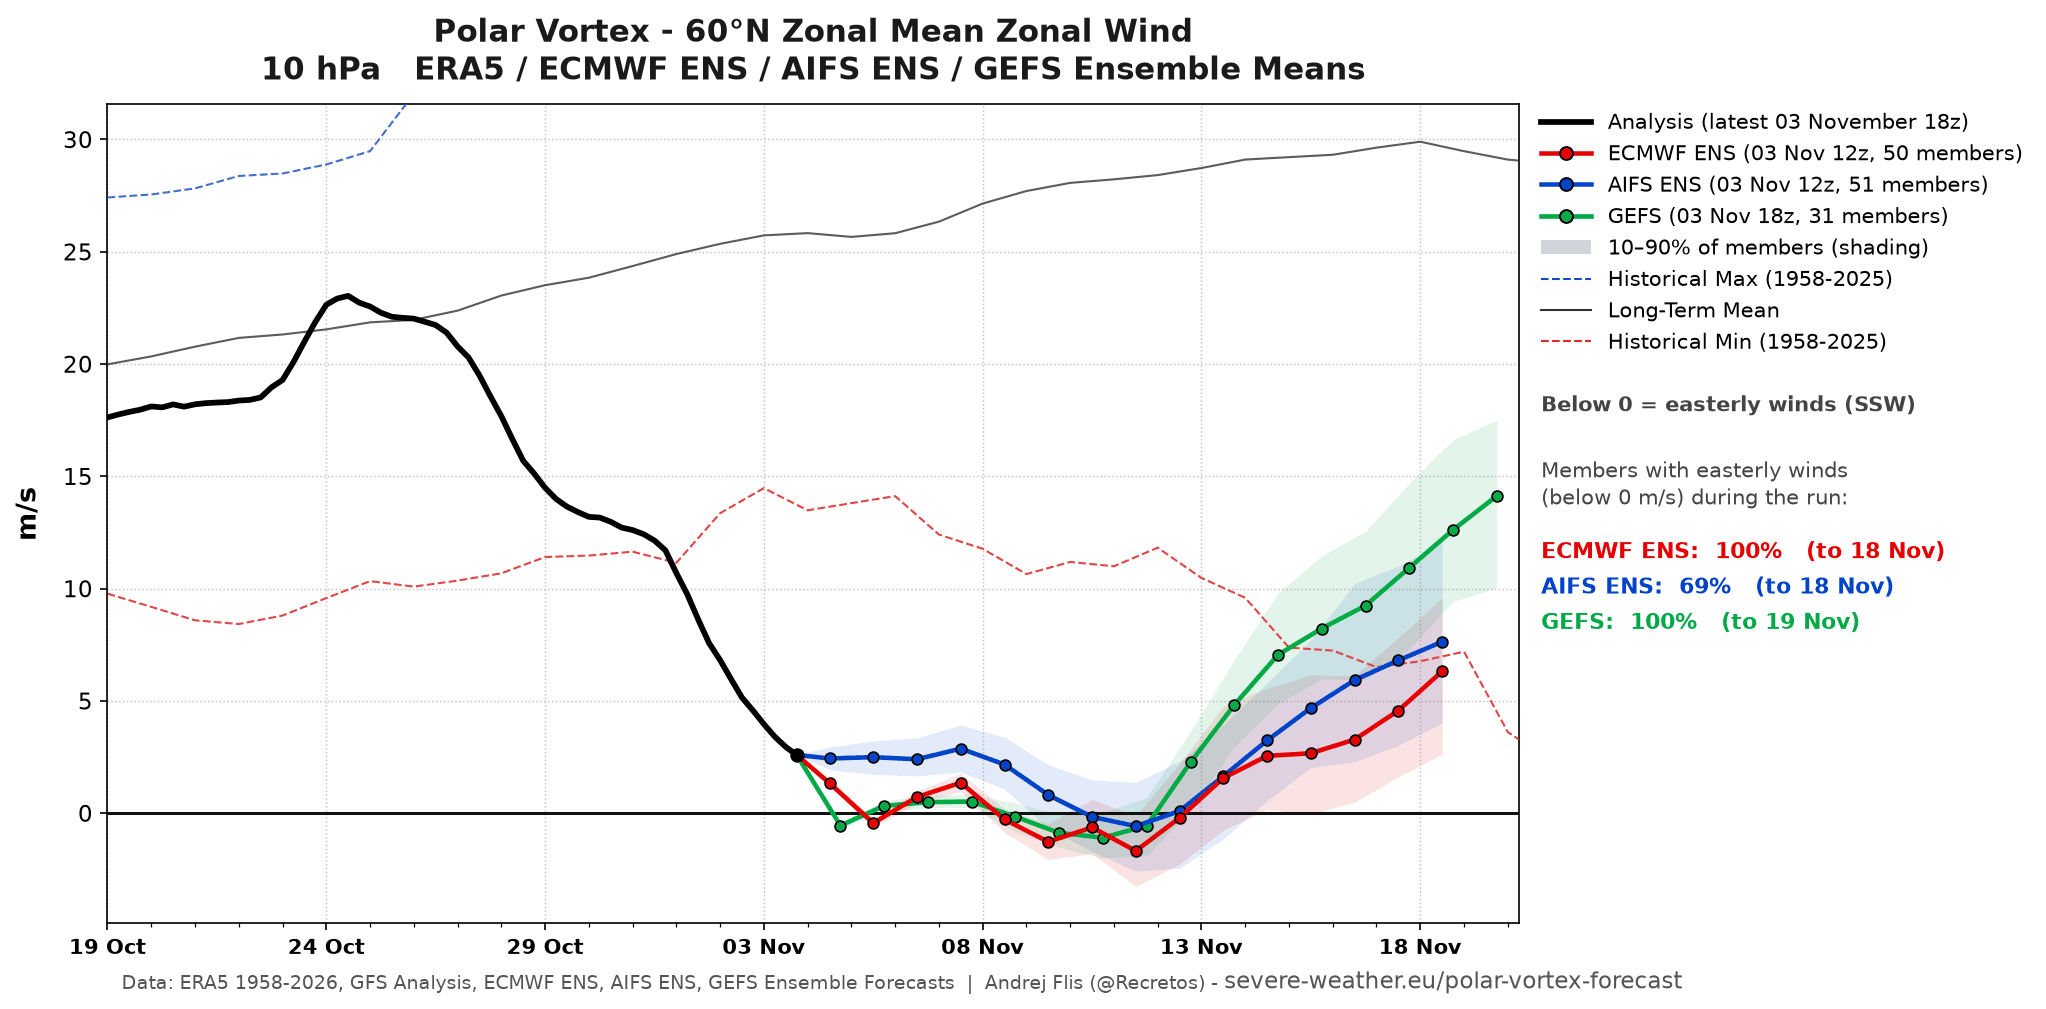
All ECMWF and GEFS ensemble members show a wind reversal at some point, making it very likely. It also looks brief, with the winds recovering by mid-November. But what makes it very unusual is its early timing and a full reversal well before any past event, as seen in the image below that compares to past SSW events.
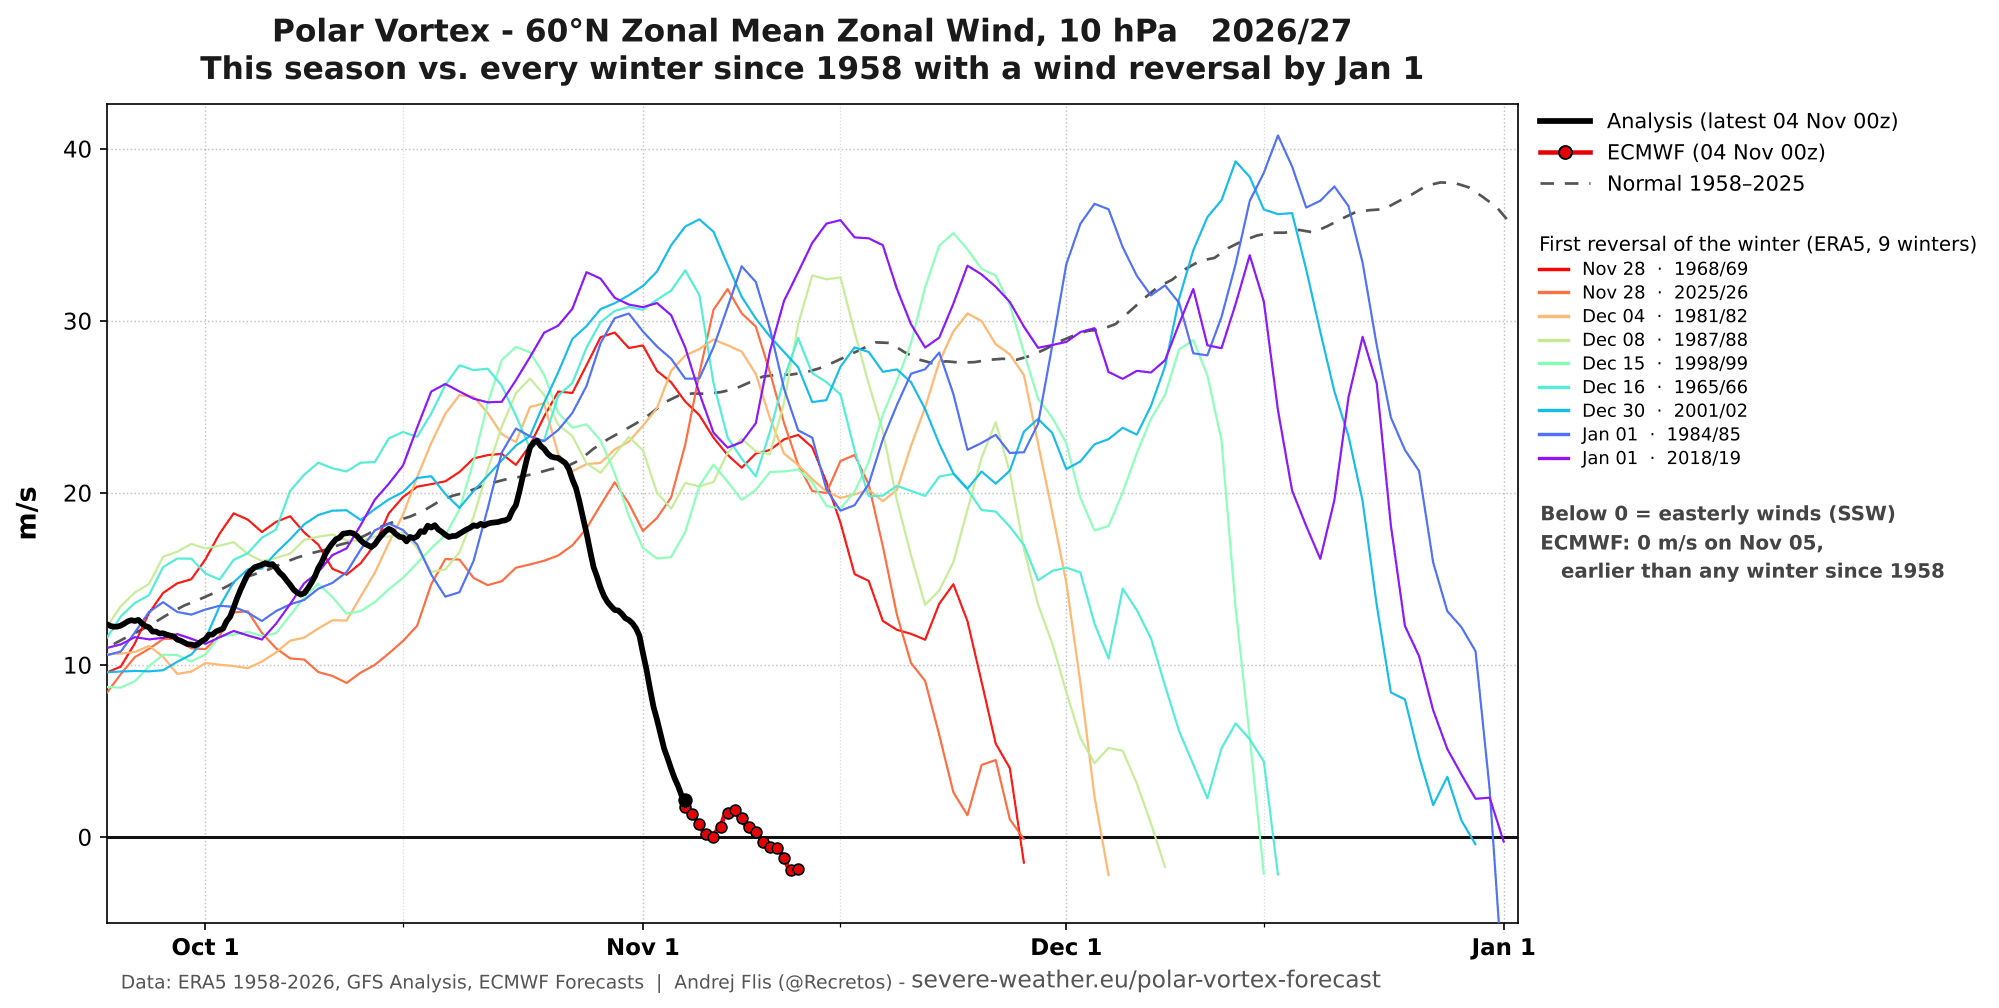
To summarize, we can see a rapid and significant disruption and slowdown of the stratospheric Polar Vortex, the earliest such on record by about three weeks. And this is important when we look at potential weather impacts this can bring.
What an Early SSW Does to December Weather Patterns
Before we look at the typical weather impacts from an early SSW event, we have to acknowledge the main global factors that can change or even deflect those impacts. We have to take this into consideration when looking for potential early winter impacts, as you will see below.
The 2026/2027 season global setup is dominated by a Super El Niño event in the Pacific Ocean and the westerly (positive) QBO winds up in the tropical stratosphere (21 km – 13 miles). The El Niño has a very strong weather grip, while the QBO plays its role in the stratosphere.
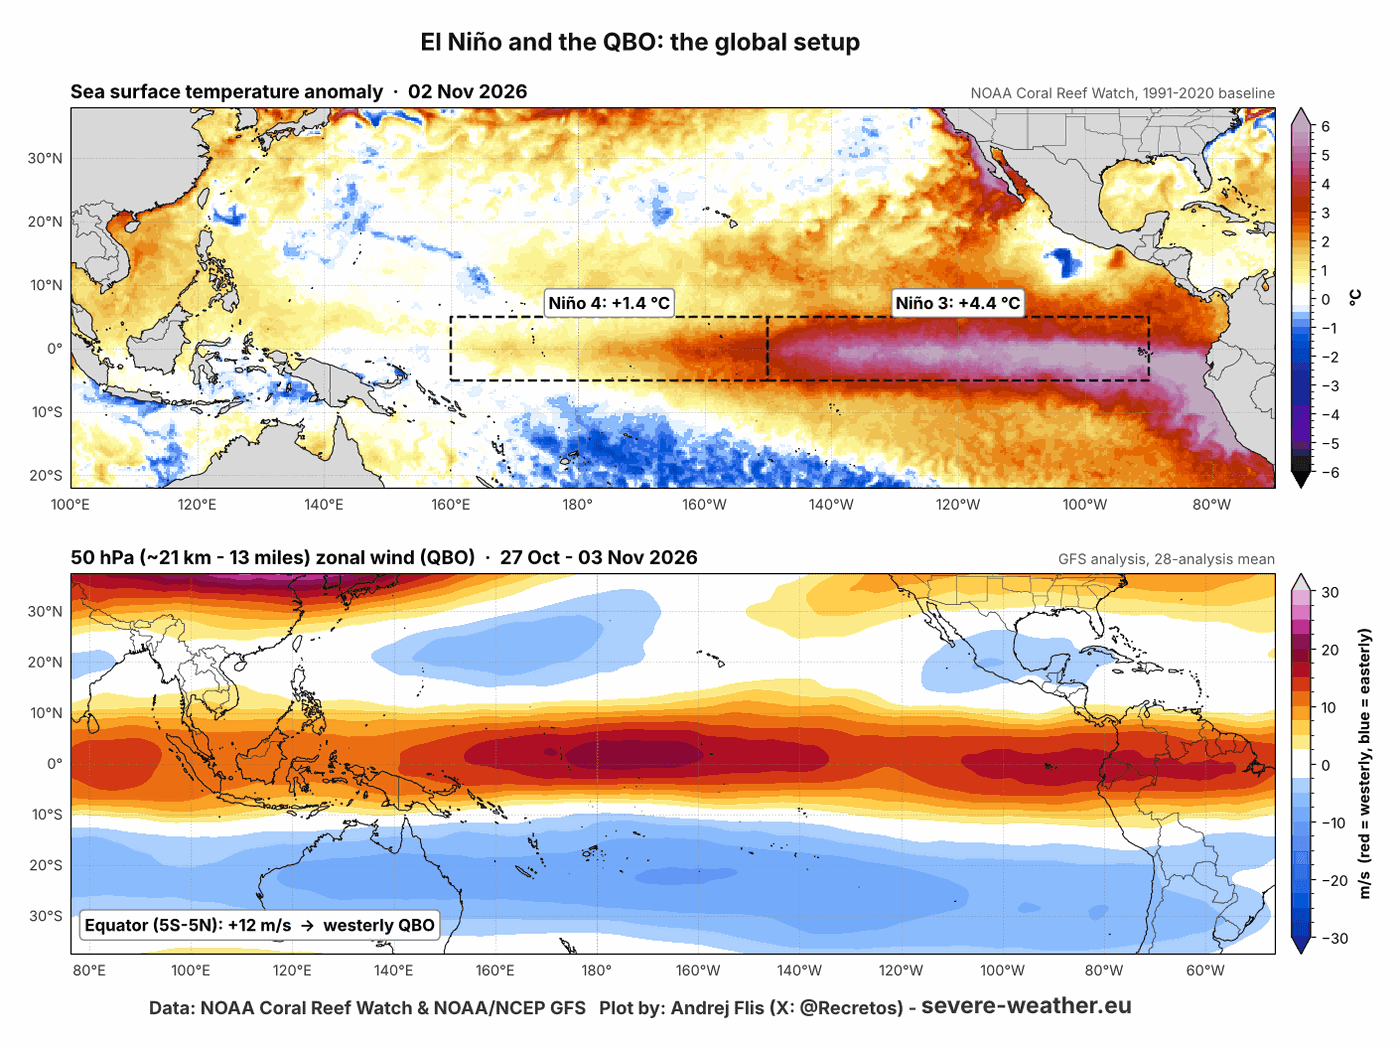
This tells us what data to look for when building early November SSW impact maps. To build these maps, I searched over thousands of simulated winters from global climate models and simulations and found 21 cases where the Polar Vortex collapsed in the same window during a strong El Niño and a westerly QBO.
I then compared them with similar global setups in which the Polar Vortex remained normal or strong, so the maps show what the early collapse itself added to the winter weather patterns. This is not a forecast for this winter, but the typical signal of an early Polar Vortex collapse which is added into the existing pattern.
Below is a look at the December data, first for pressure anomalies. This shows the pressure anomaly signal from the SSW itself, since all years have the same global setup. Over North America, we can see a low-pressure trend over the western U.S. and southwest Canada, and high pressure toward the east.
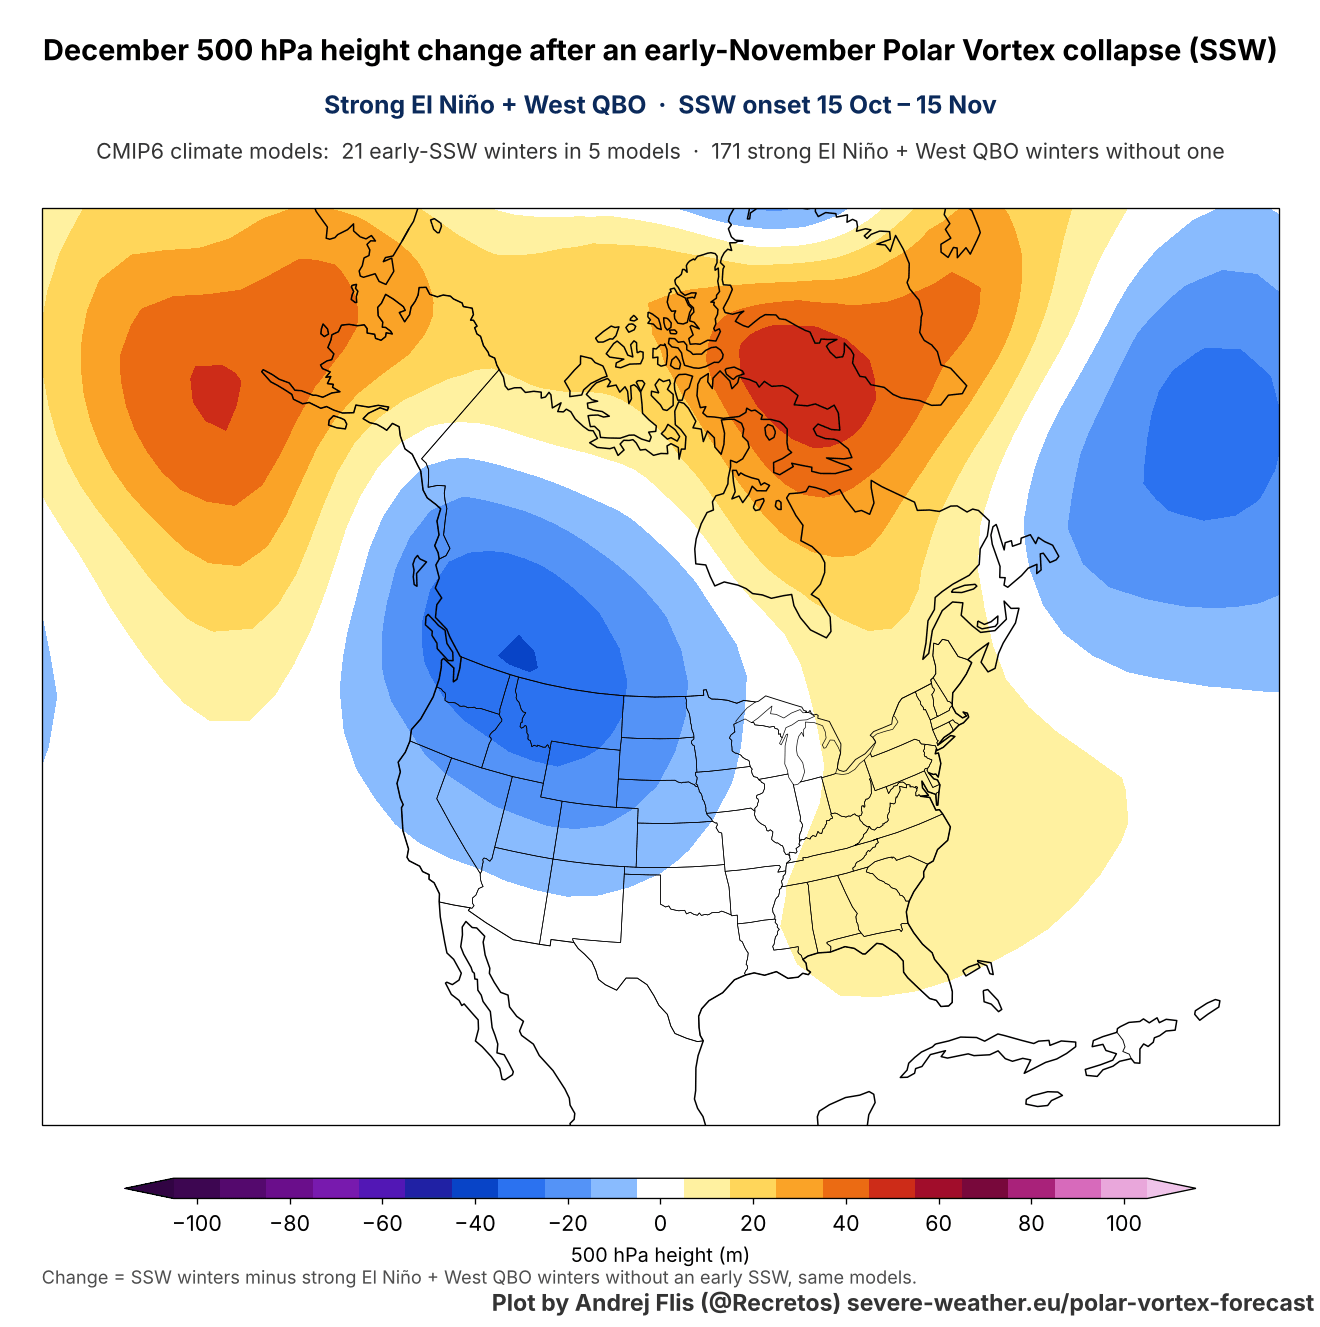
This looks like an attempt to boost the existing strong El Niño signal with an amplified westerly flow over the southern United States. The data above shows the Decembers that followed an early November SSW, revealing its early winter signal development.
The temperature signal is a different story. Here we can see a decent cold anomaly extending from western Canada into the United States. This is actually similar to what we can expect from a normal mid-winter Polar Vortex collapse. We must not forget this is still the SSW signal, not the actual weather outcome.
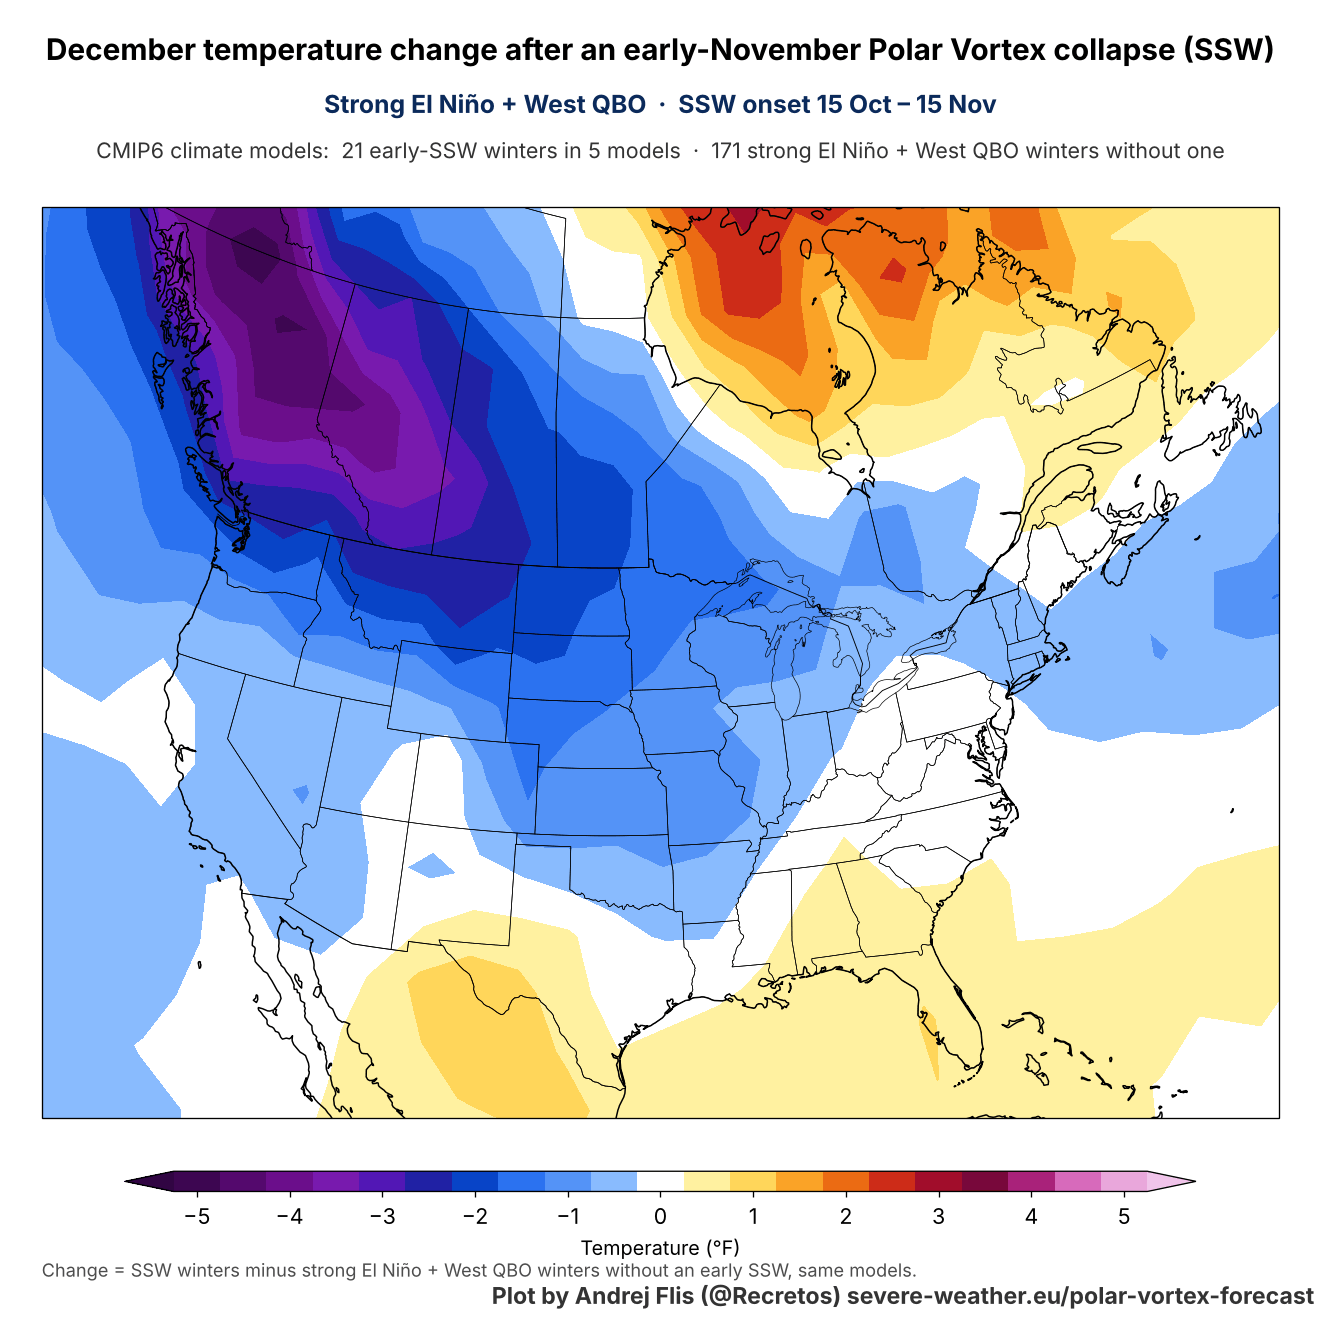
This year, such a signal is contradictory to a Super El Niño forcing, as the biggest warm anomaly wants to build right over western and central Canada. So the SSW signal can still be there, but suppressed and hard to see during a Super El Niño as strong as in 2026/2027.
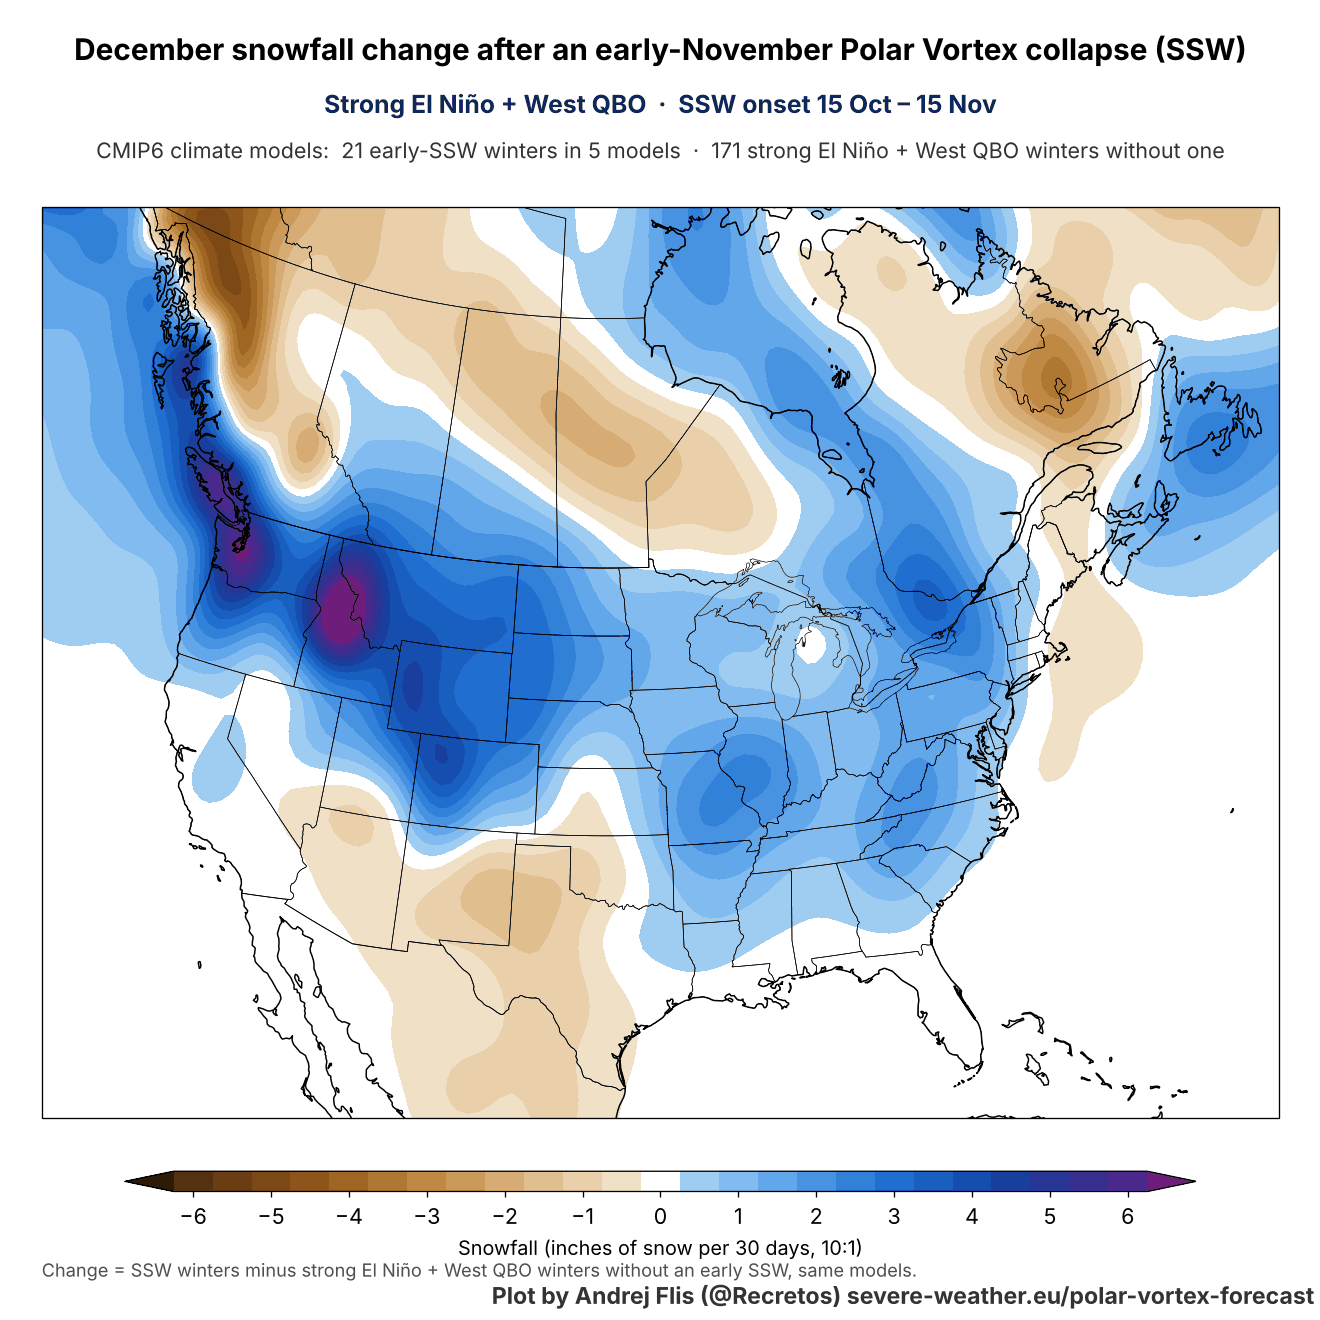
Looking at the snowfall trends from the same dataset, we do see increased snowfall signal over the northern and eastern United States, and parts of southwestern and eastern Canada. This is again the SSW signal, not the overall anomaly. And it nicely shows why we are always so keen on following the stratospheric events, as the outcome can be very interesting.
Over Europe, the SSW signal for December shows a low-pressure anomaly towards the east and north, with a ridge over the western parts. This can be seen even in mid-winter SSW events, so the overall pressure signal is not very different from a November Polar Vortex collapse.
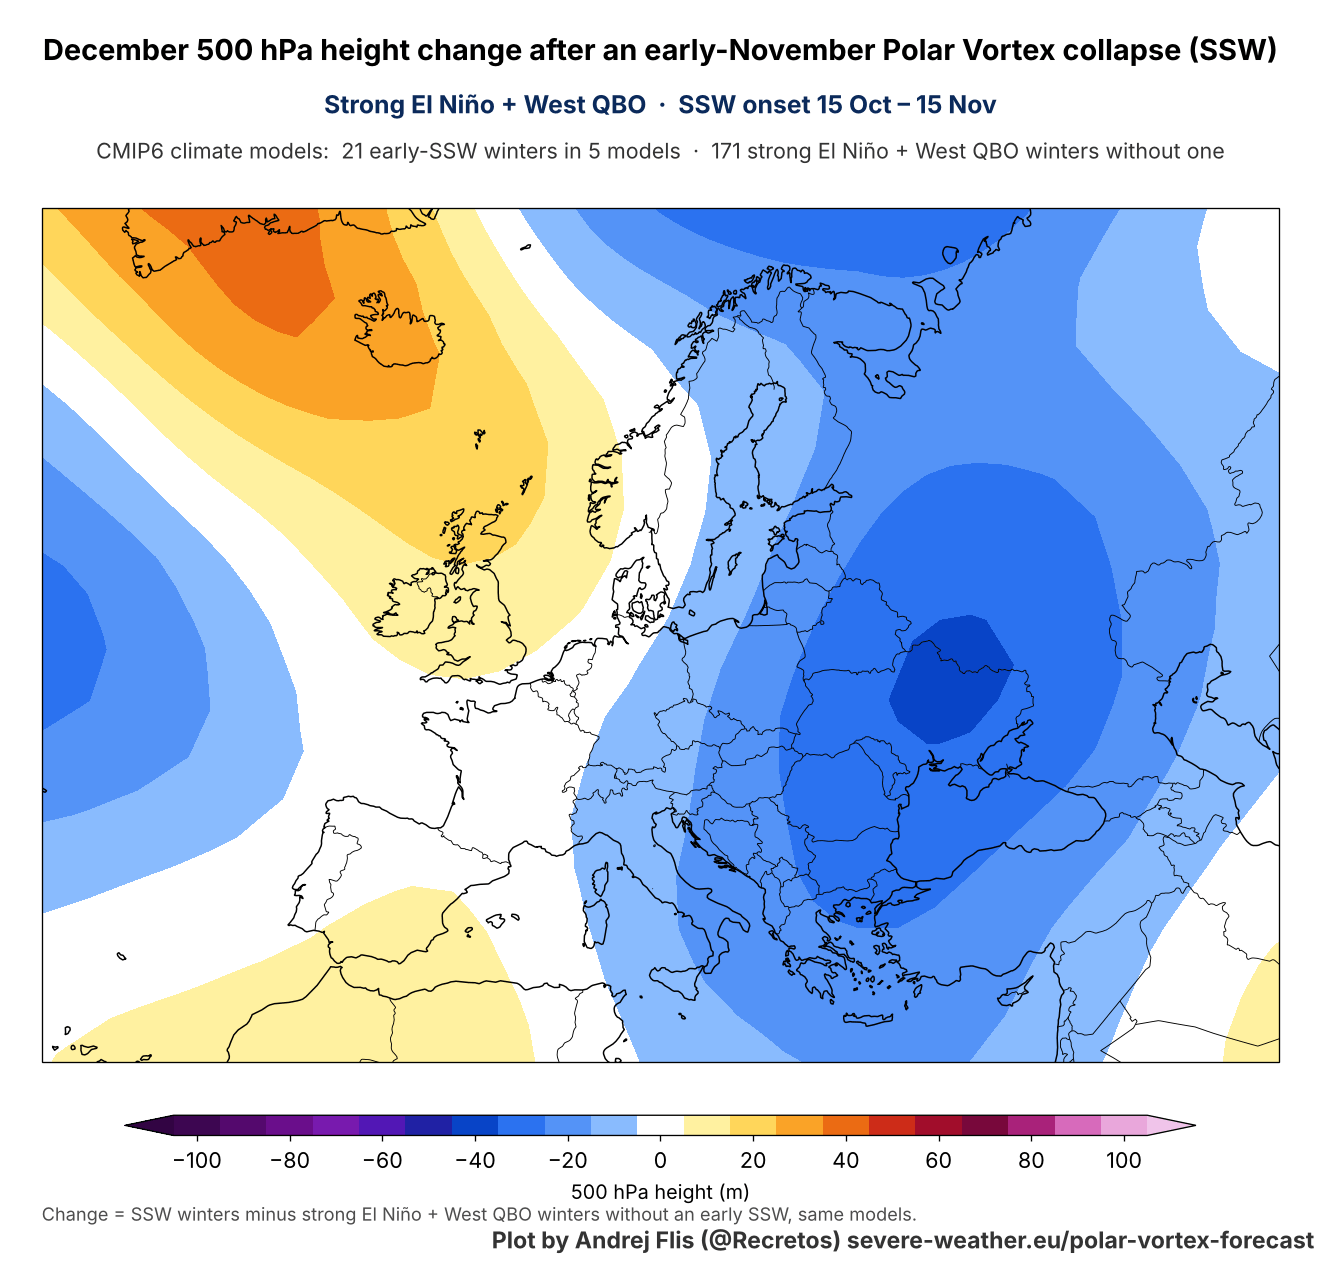
As expected, this pressure pattern means northerly flow into the continent, since a low-pressure system spins counter-clockwise. And we can see the SSW temperature signal for December does show below-normal temperatures across the continent.
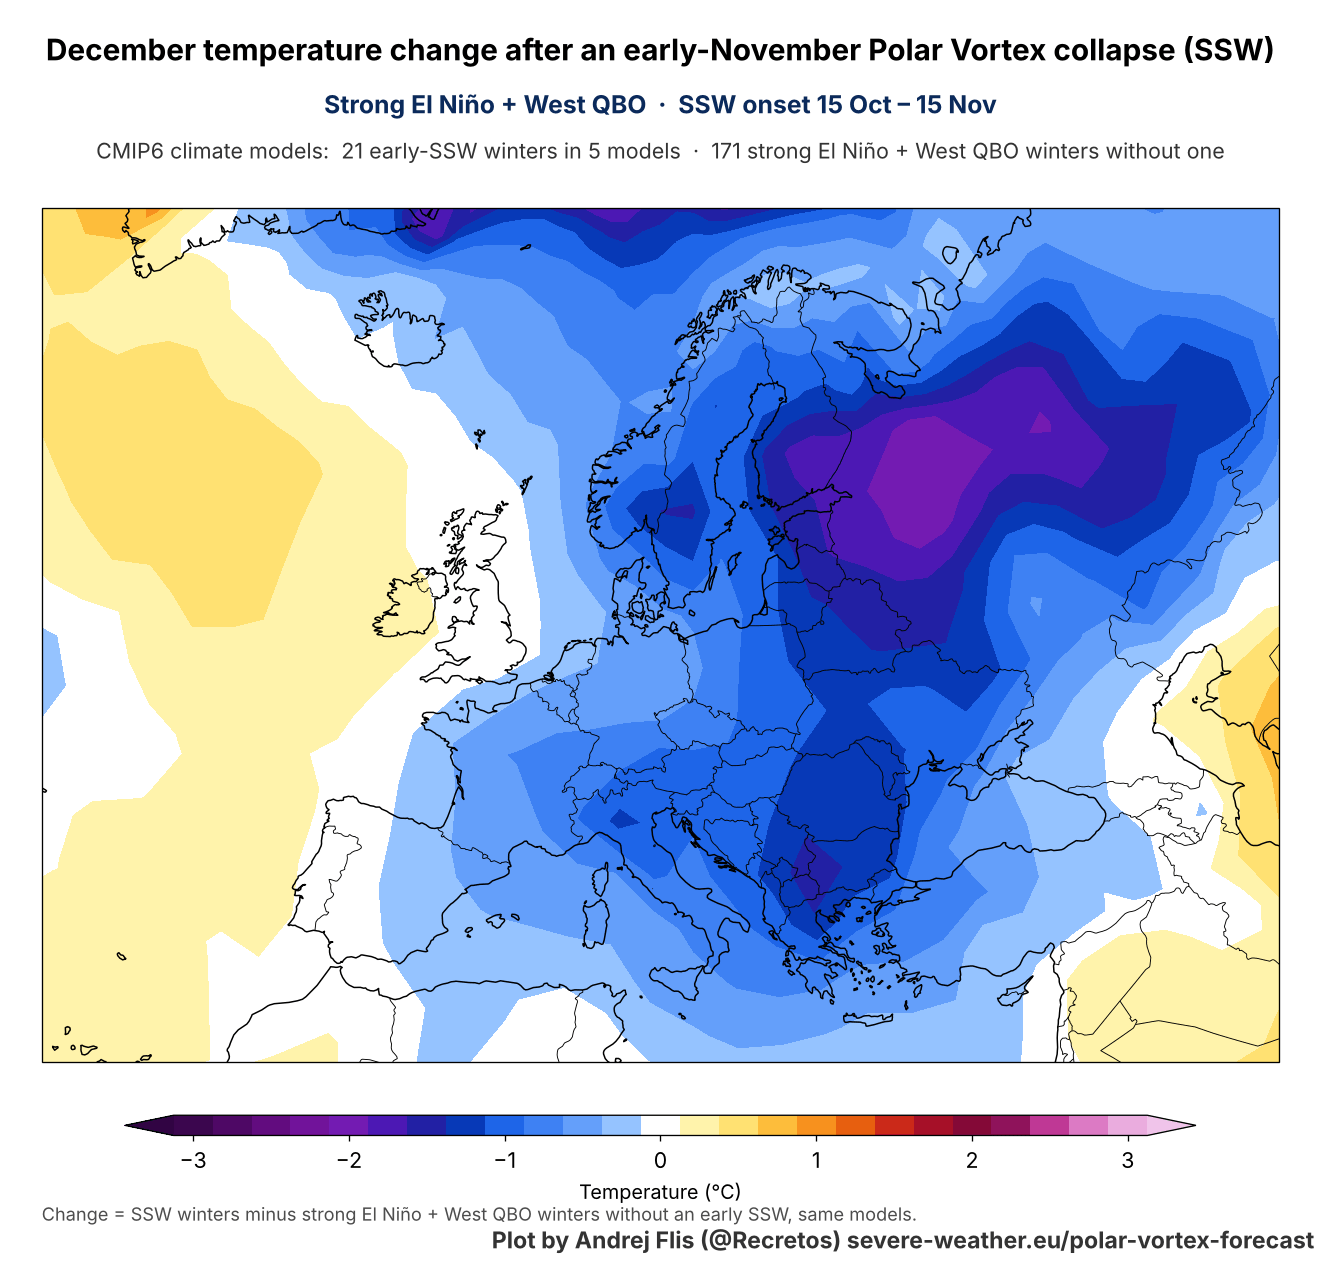
In a normal atmosphere and in mid-winter, such a pattern can bring decent cold air into Europe, with some variations being called “Beast from the East” in some events. But this is not a forecast, just a simulated early November Polar Vortex collapse signal for December.
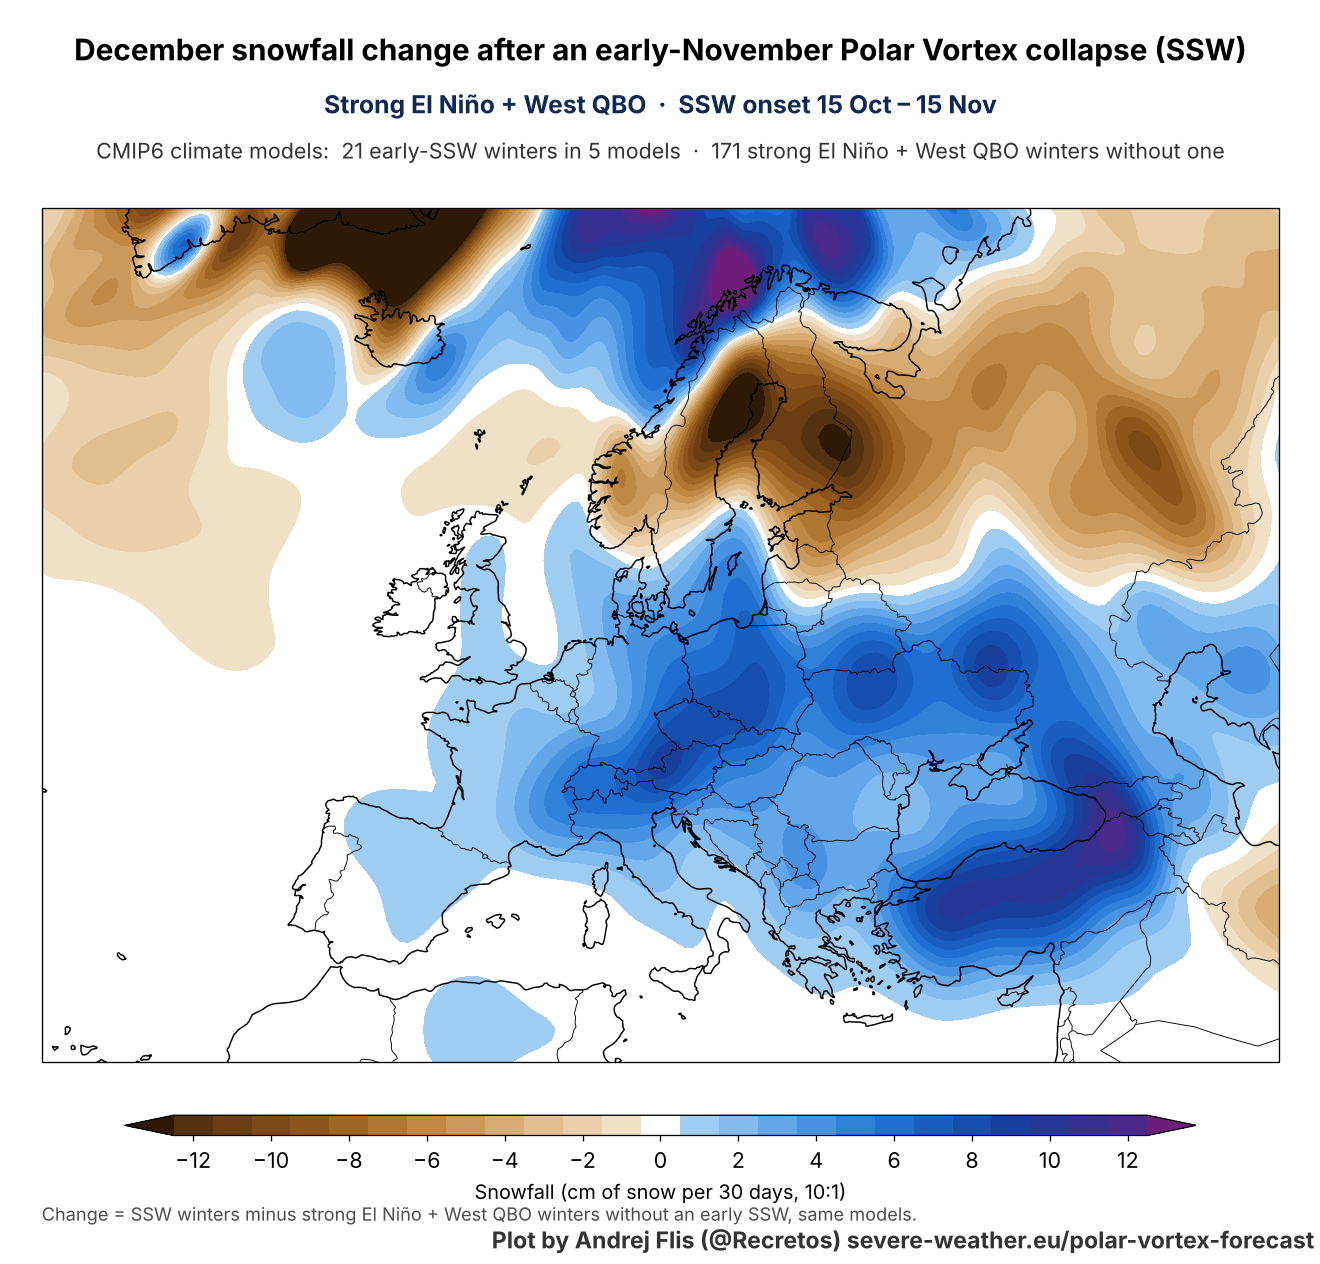
The snowfall signal follows this pattern, bringing above-normal snowfall to a large part of the continent, except for the north and northeast. Both over the United States and Europe, an early November Stratospheric Warming gives a positive signal for Winter weather to follow into December, but it has to survive the existing weather patterns.
These impacts of the Stratospheric Warming event can hide in the general circulation, as this is just its own signal. To oversimplify, if the Super El Niño wants to put a +5°F anomaly over Canada, and the SSW goes for -3°F, that can still end up +2°F above normal, despite the cold signal map.
We can look at the latest trends for the end of November to see if any similar patterns show up, despite the very strong El Niño event.
Late November Forecast: First Impacts From the Stratospheric Warming?
Below is the extended range trend for late November (week 4), which is in the range where we could start seeing some signals. But if the signal is there, it’s likely buried in the overall Super El Niño forcing: the main high-pressure area over Canada, the amplified low-pressure zone in the North Pacific, and a storm track over the southern United States.
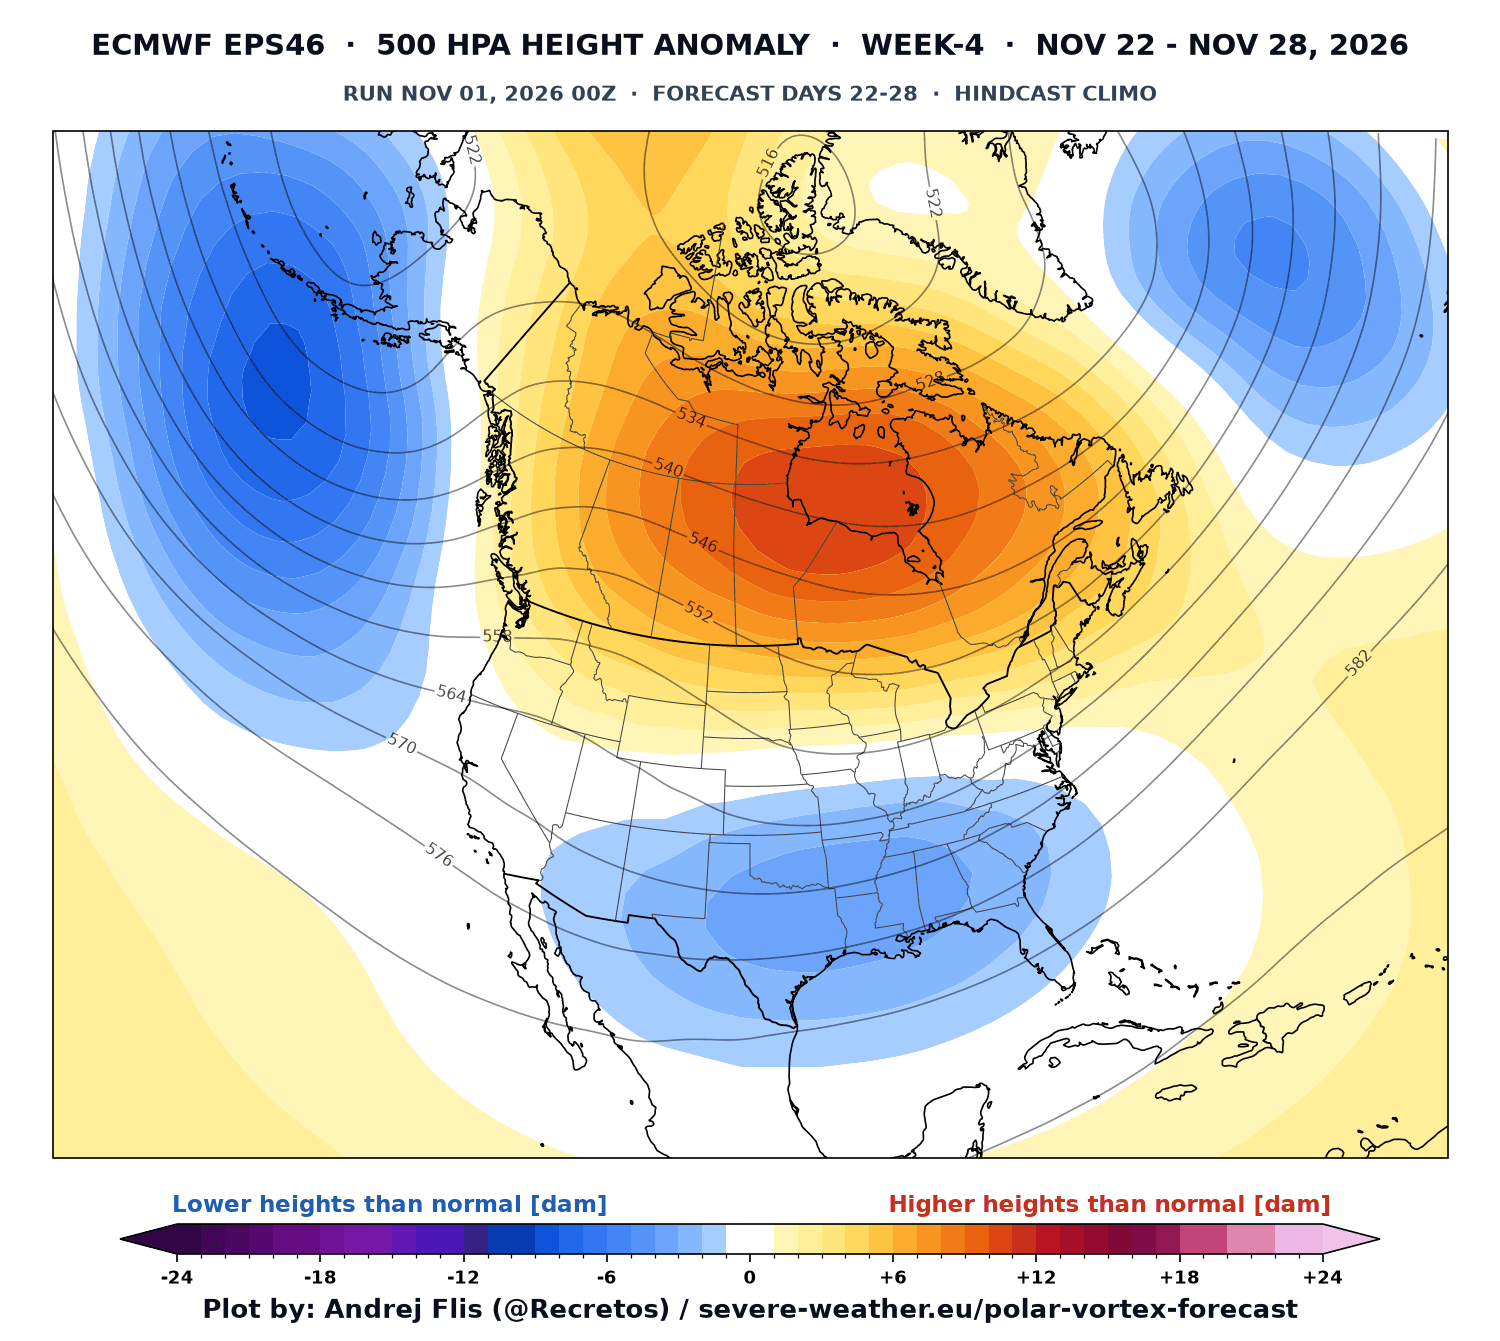
This is a clear Super El Niño pattern and is perhaps slightly ahead of time in intensity. But it is to be expected, as we are dealing with the strongest Super El Niño in decades for 2026/2027.
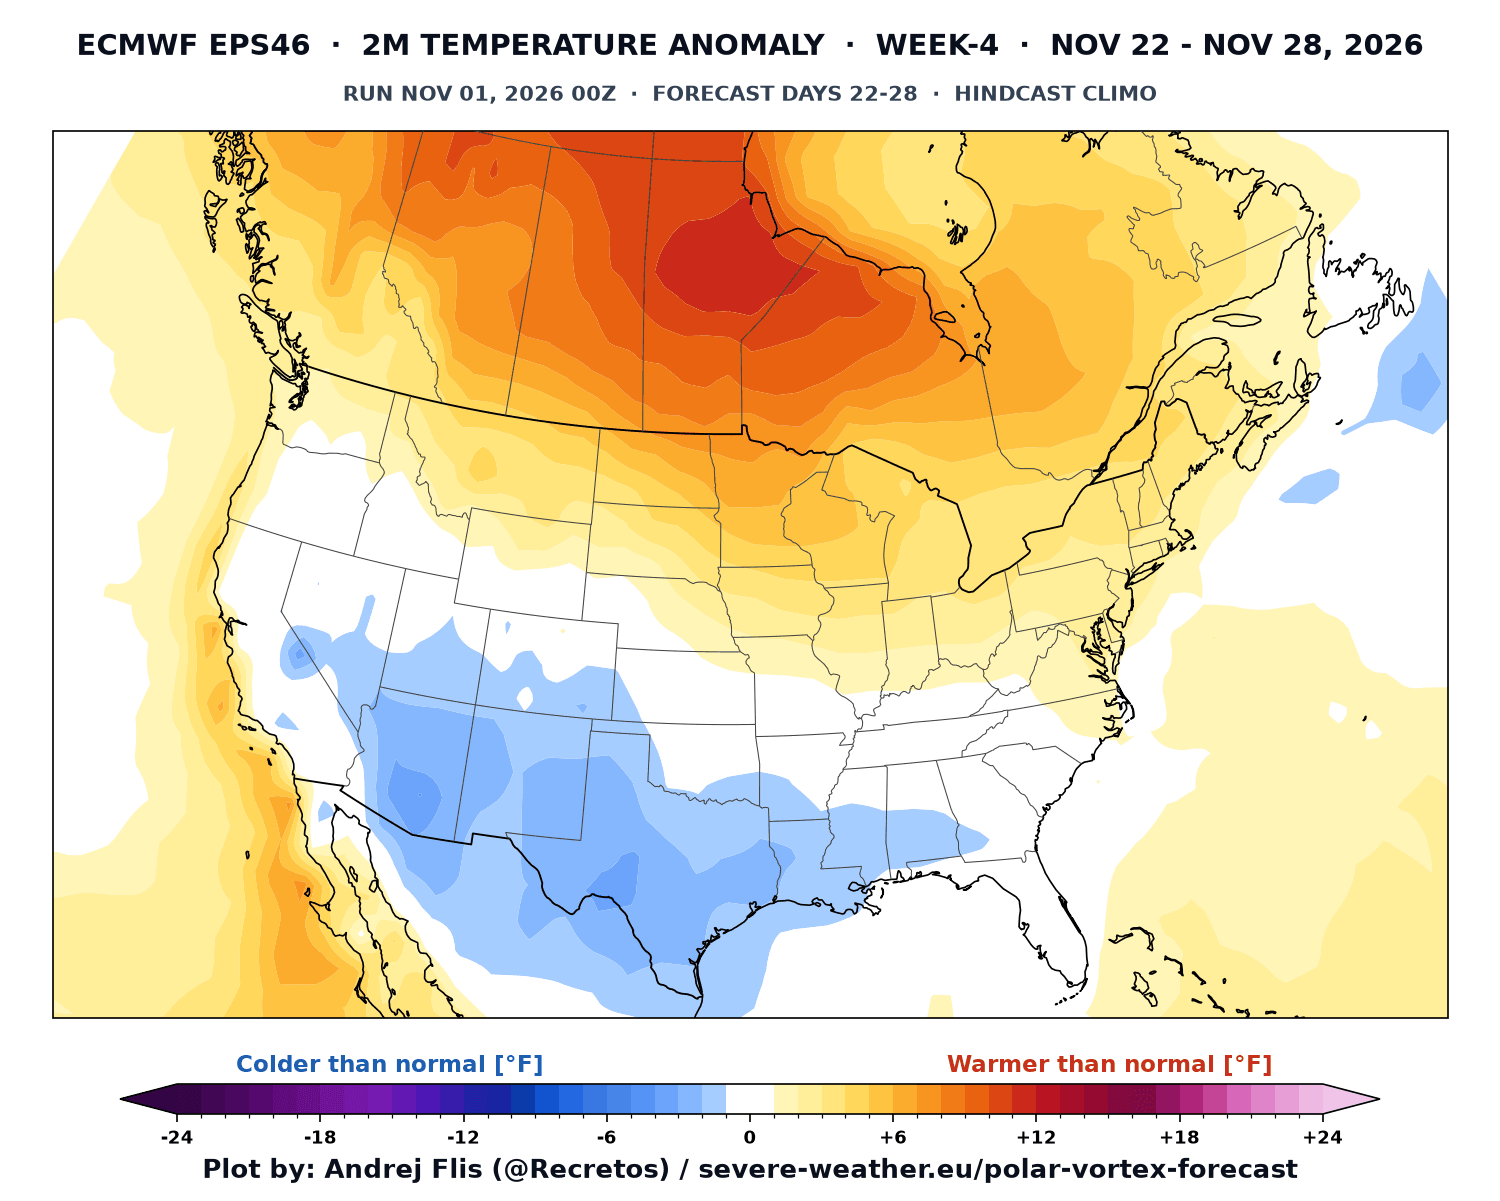
The temperature trend for this period shows the warm anomalies under the high-pressure zone in Canada and the northern U.S. But we are starting to see a cooling trend over the southern half of the United States, under the active storm track.
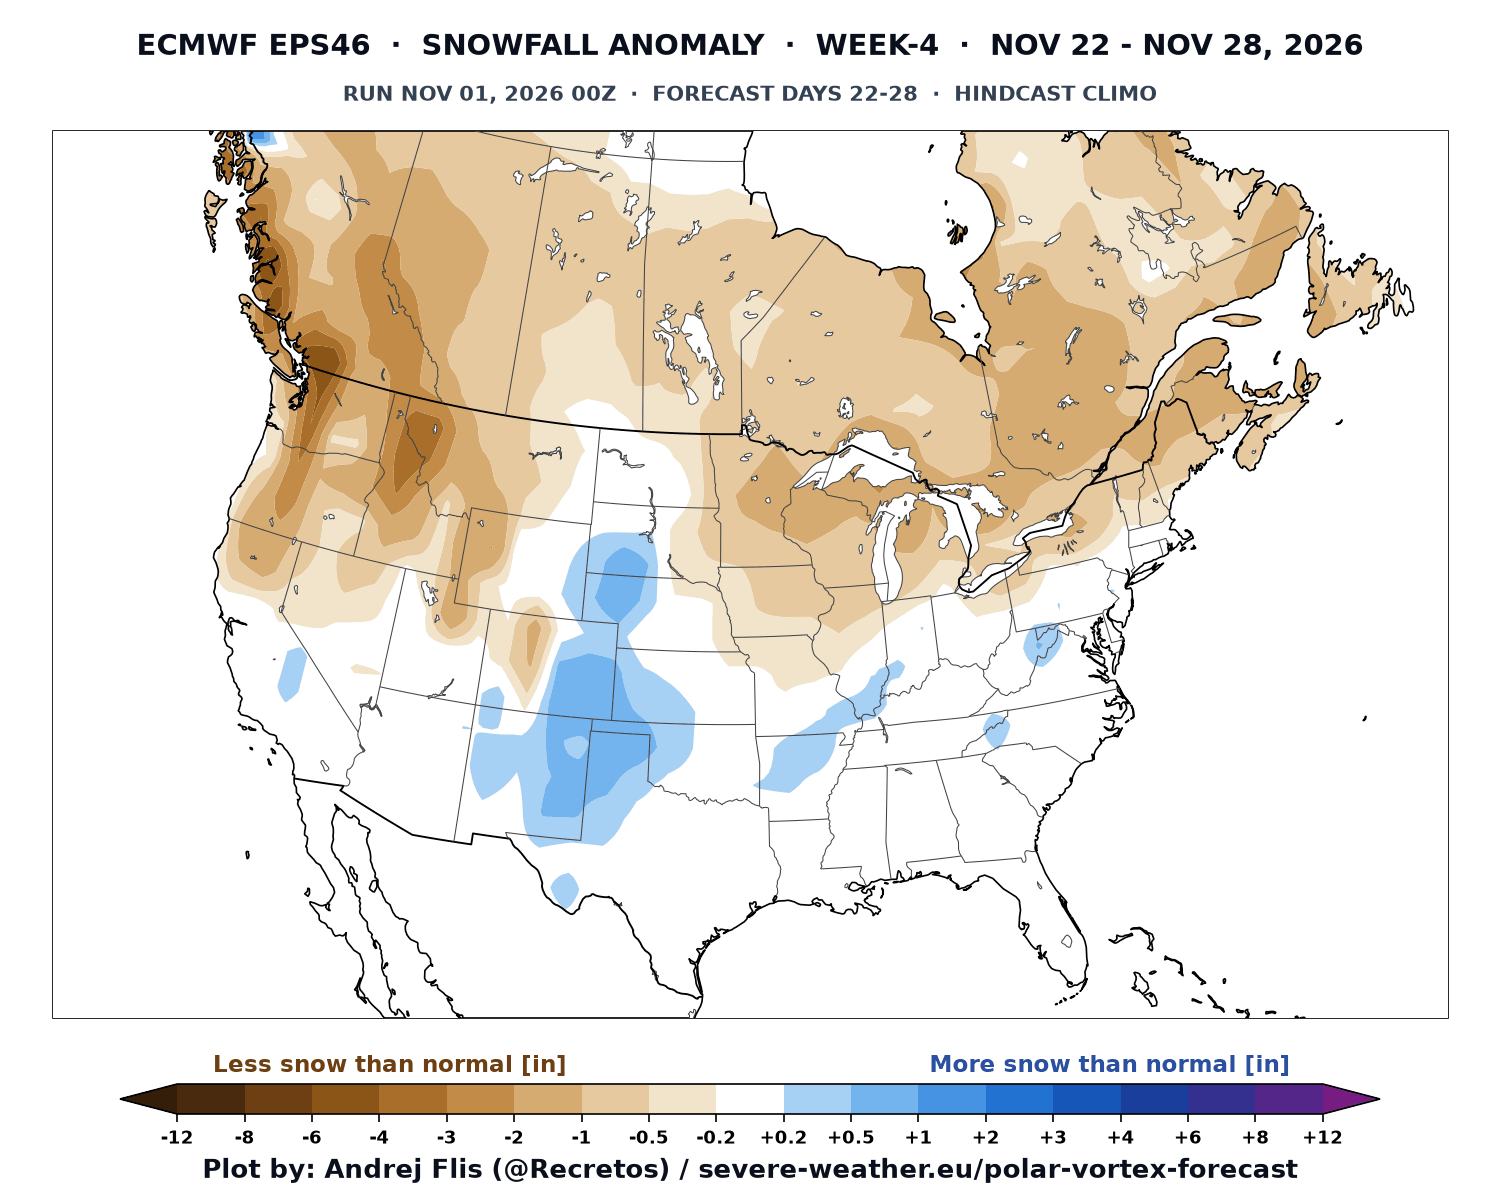
The snowfall trends in this range show some snowfall signal for the Plains and towards the eastern United States. We see well-below-normal snowfall for the northern United States and Canada under the influence of the high-pressure area.
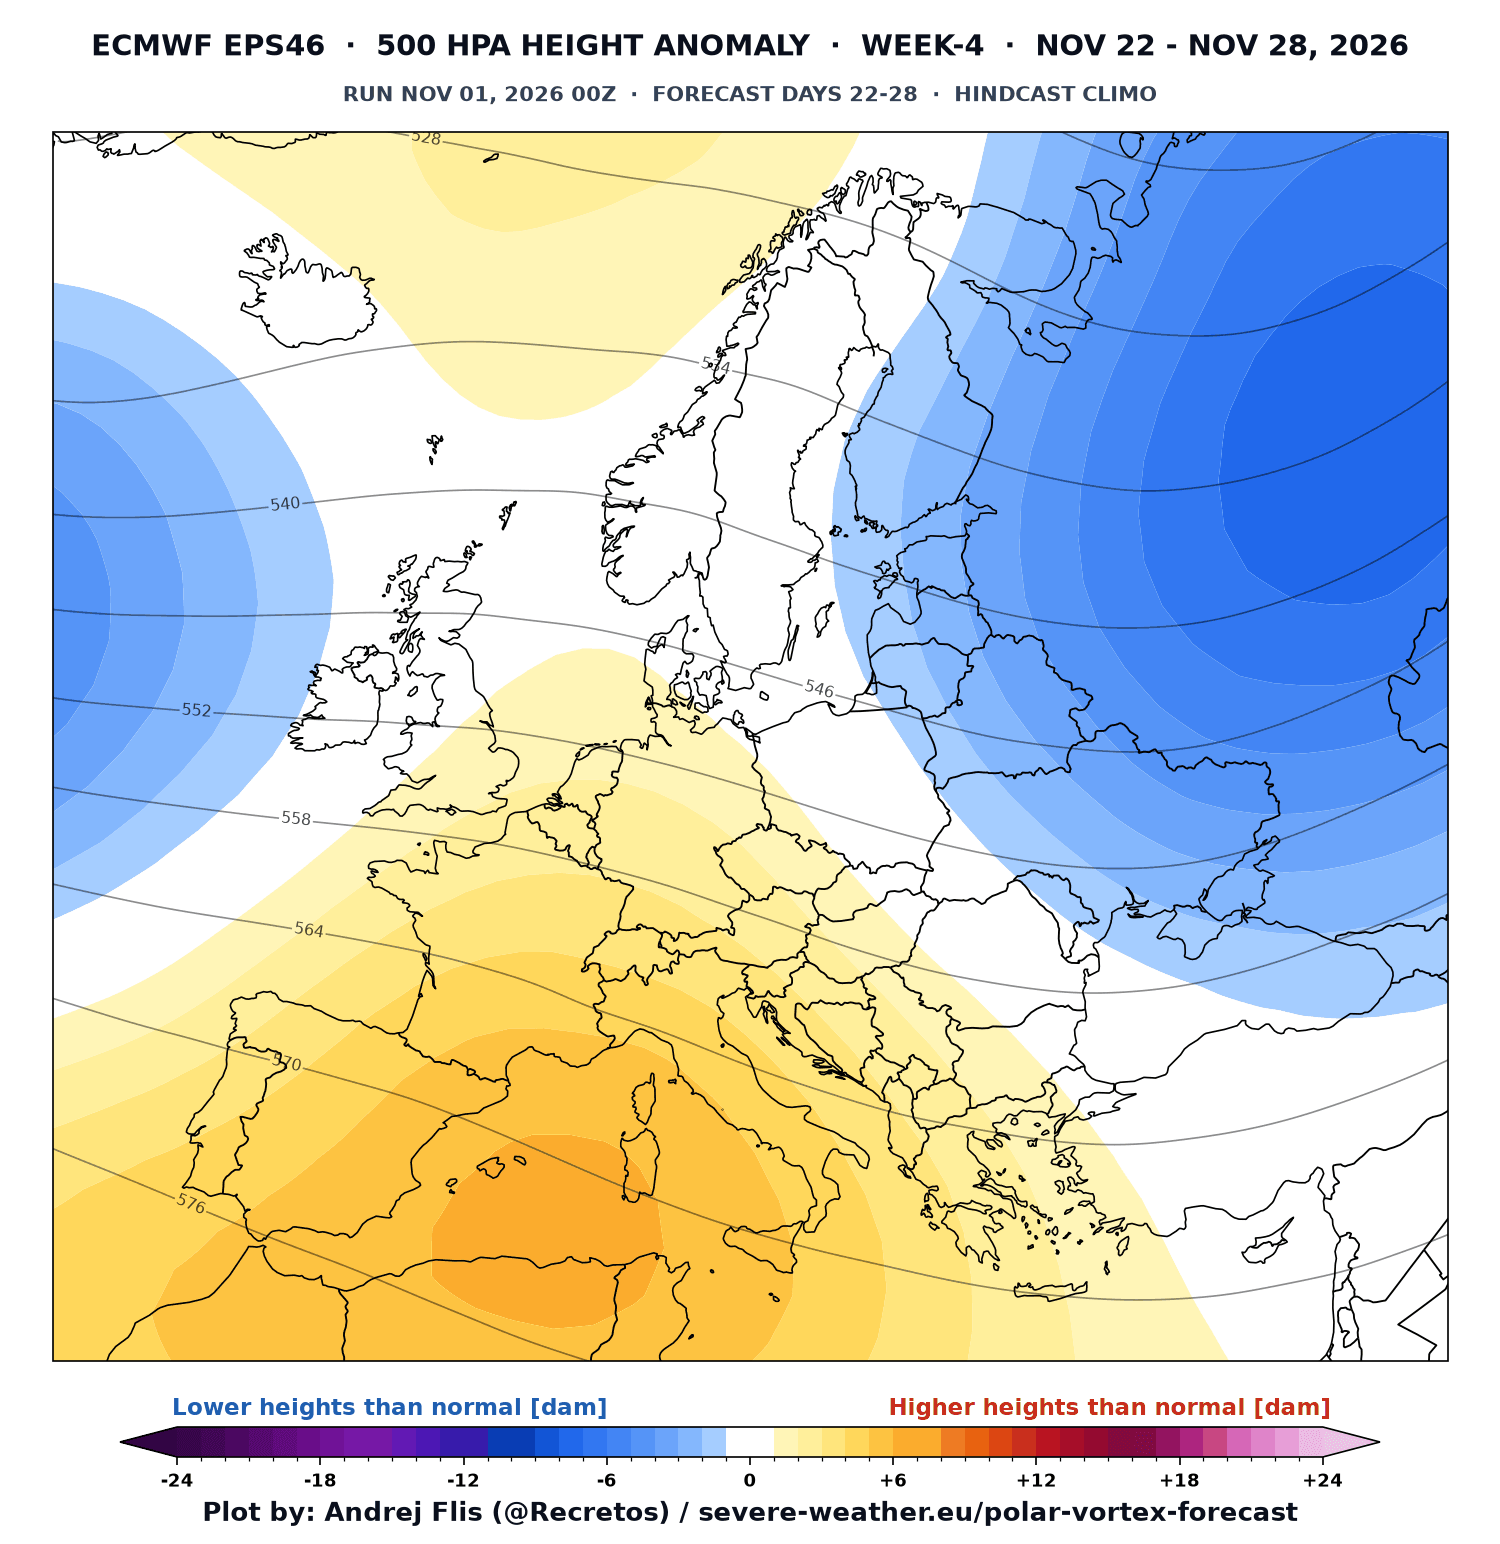
Over Europe, we can actually see a much more similar pattern to the post-SSW impact. A ridge over the southwest and a low-pressure zone to the northeast. We can’t say this is purely due to the stratospheric warming event, but the pattern is a good match to what we expect to see.
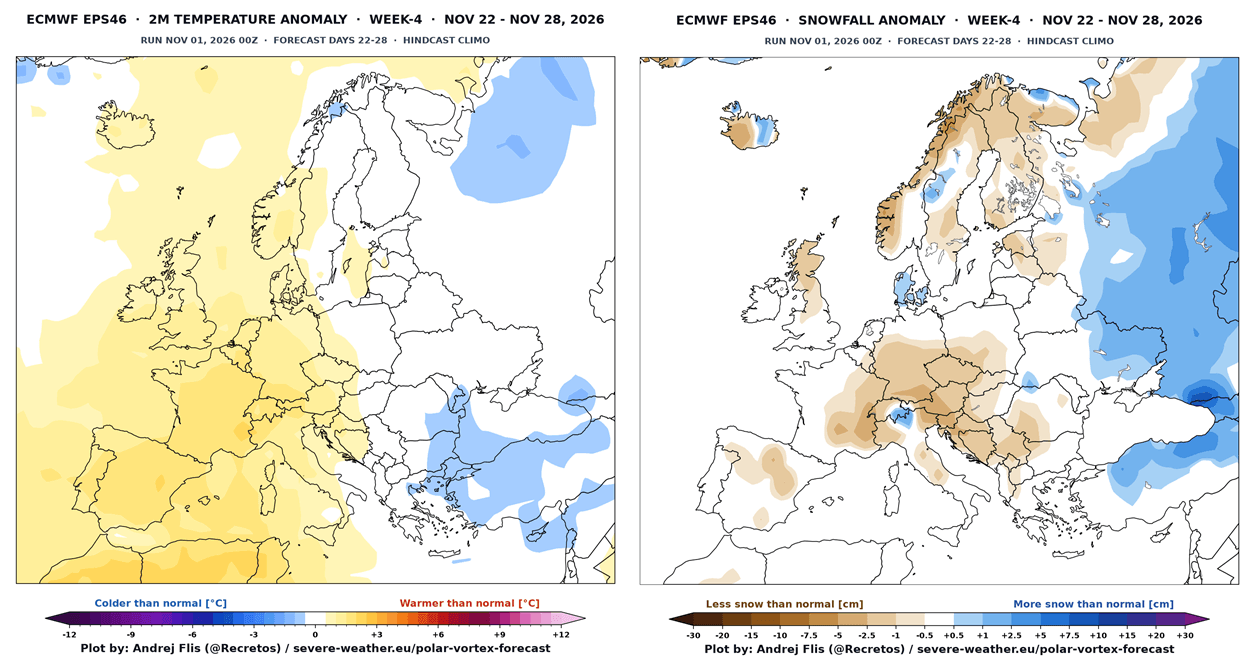
The temperature and snowfall forecast for the same period is much less extreme than the SSW signal in the images above. But we can still see a below-normal area towards the east, where it overlaps with a snowfall anomaly. The rest of the continent shows less snowfall than normal with above-normal temperatures.
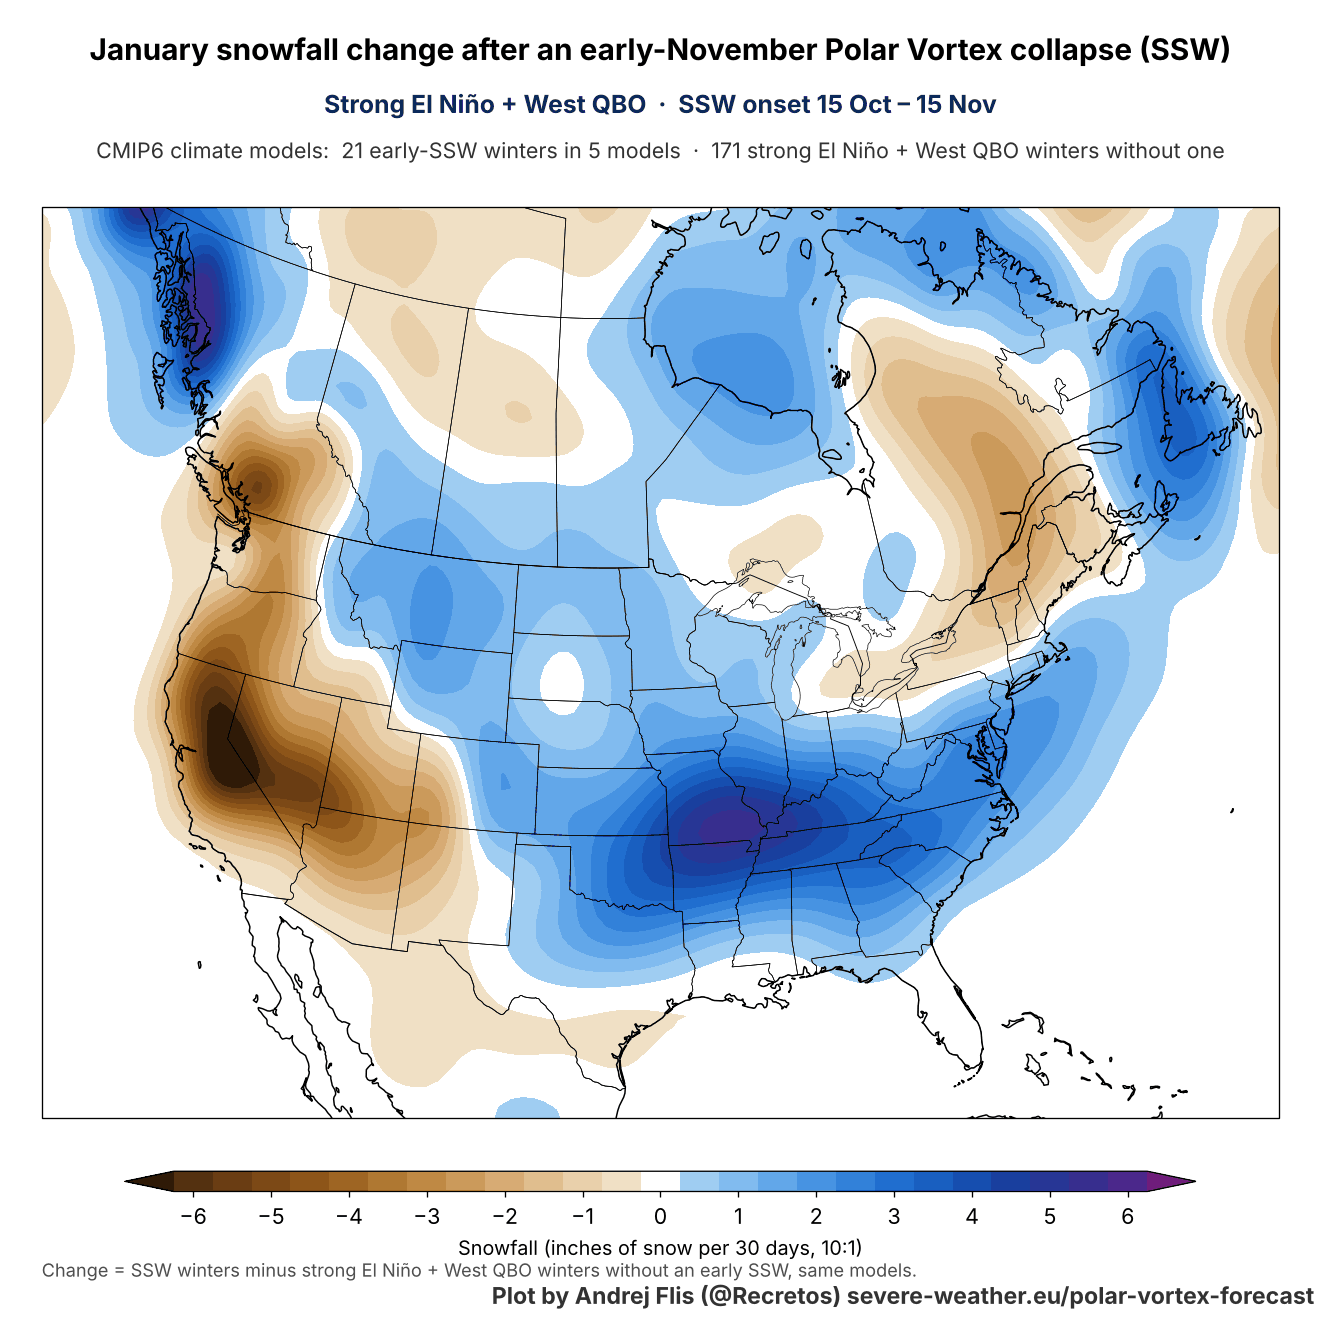
I also created the January impact maps, to see how the early SSW signal carries into mid-winter. As with December, maps below are not the expected weather pattern, but the change the early SSW adds on top of the existing El Niño pattern.
Follow our Search Profile to see our latest Stratosphere and Polar Vortex analyses directly in Google sources.
January: A Clearer Signal From the Polar Vortex Collapse
The early SSW pushes a high-pressure anomaly over the Northeast Pacific in January, with a low-pressure anomaly over Canada that extends into the northern United States and the Great Lakes. A northwesterly flow develops between the two systems, bringing cold air from Canada into the central and eastern United States.
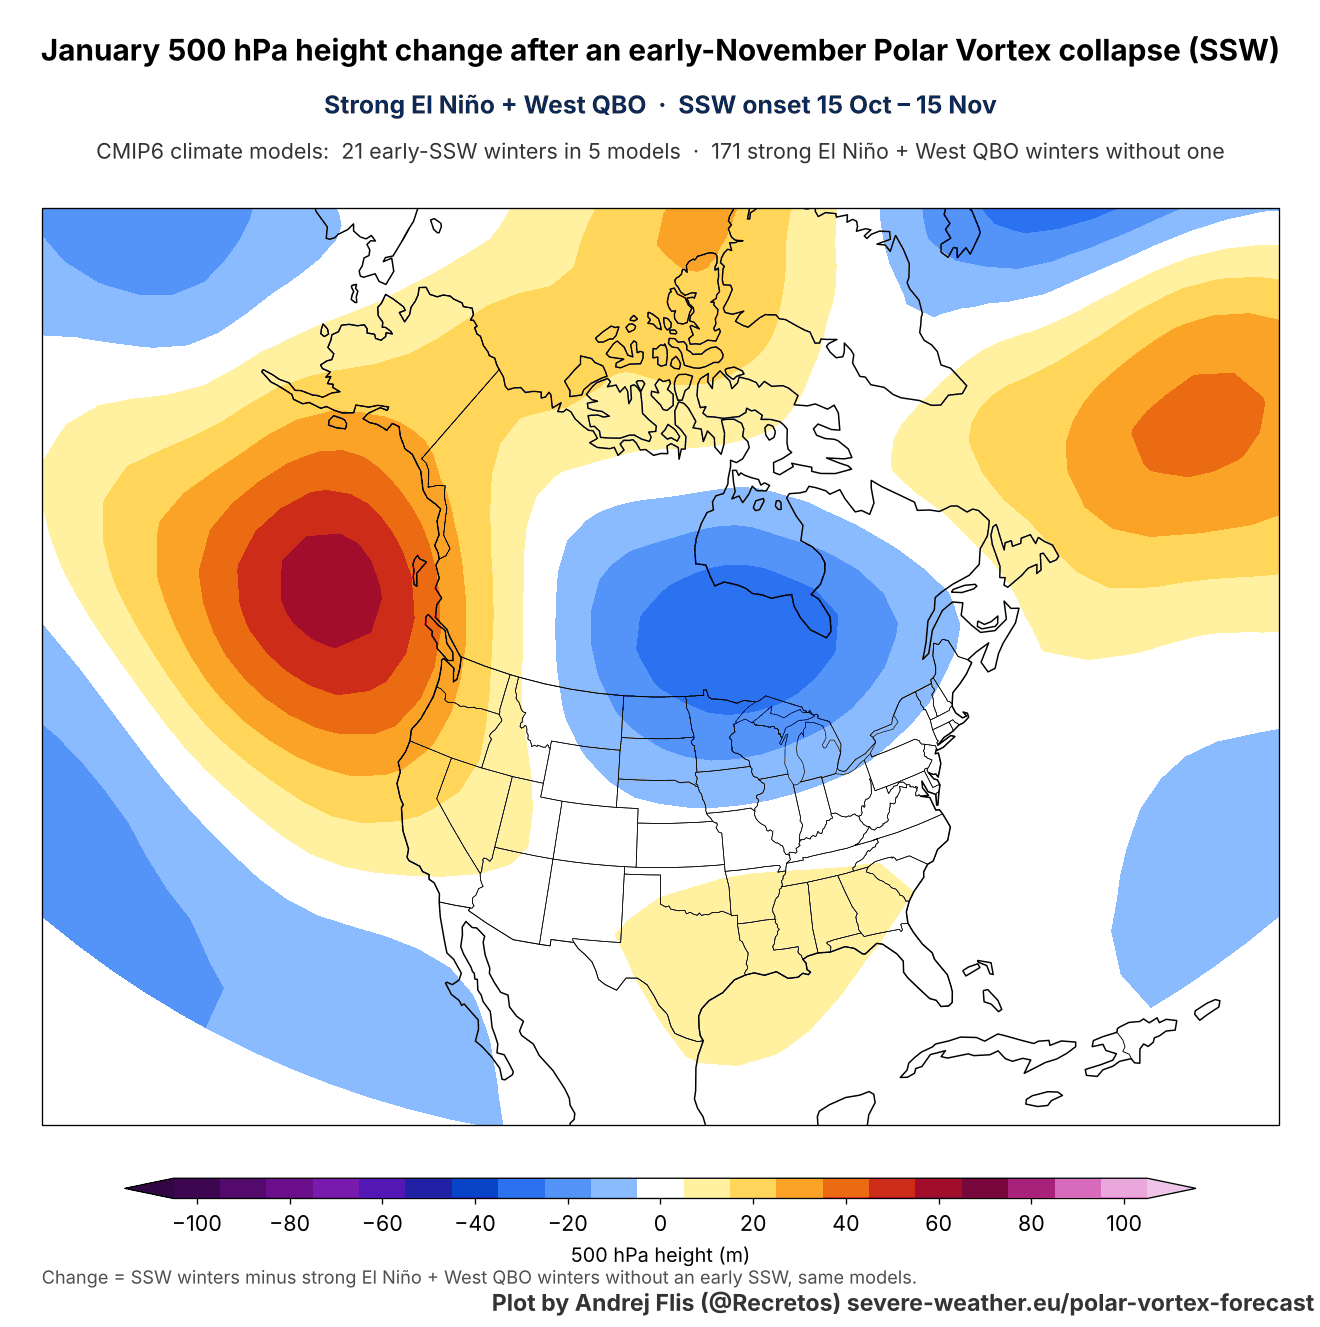
This is quite different from a typical Super El Niño January, which normally has a deep low in the North Pacific, high pressure over Canada, and an active storm track across the southern United States. In a real winter, the two patterns overlap, so the SSW signal can weaken the El Niño pattern over Canada, but it’s unlikely to replace it entirely.
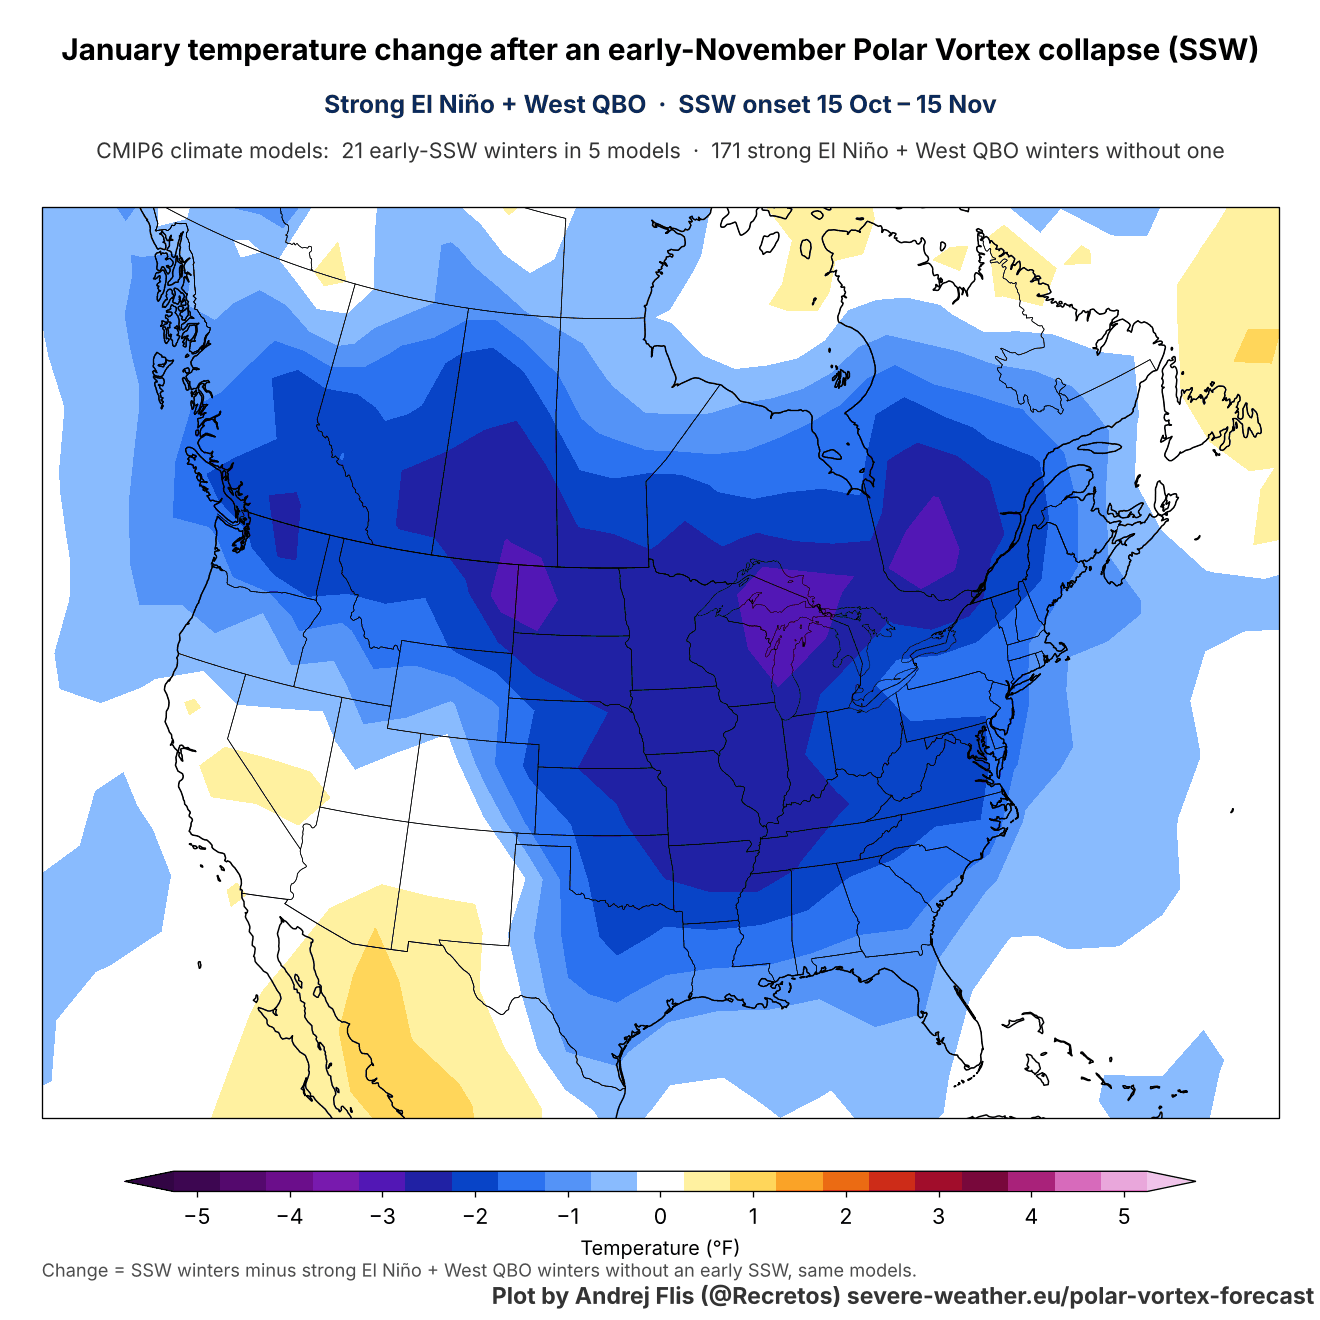
The January temperature data shows this colder anomaly signal over the United States and Canada. This does not look like a super El Niño pattern, as mentioned, but it is a clean signal from the early November Stratospheric Warming. The cold signal is strongest over the Midwestern, northern, and eastern United States.
The January snowfall signal follows this cold spill, as we can see with the increased snowfall signal from the Plains through the Ohio Valley into the Mid-Atlantic, while the West, especially California and the Great Basin, and eastern Canada trend drier. We might see this appear in the January forecast trends, but the Super El Niño is really exceptional this year and is trying to force its own pattern.
We have no real weekly forecast trends for January. But we can look at the very latest long-range data from the Canadian CanSIPS forecast, released just a few days ago. It’s not regarded as the best seasonal forecast out there, but it is the latest update, and it does show an interesting temperature trend for January, with below-normal temperatures over the central and southern United States, into parts of the East.
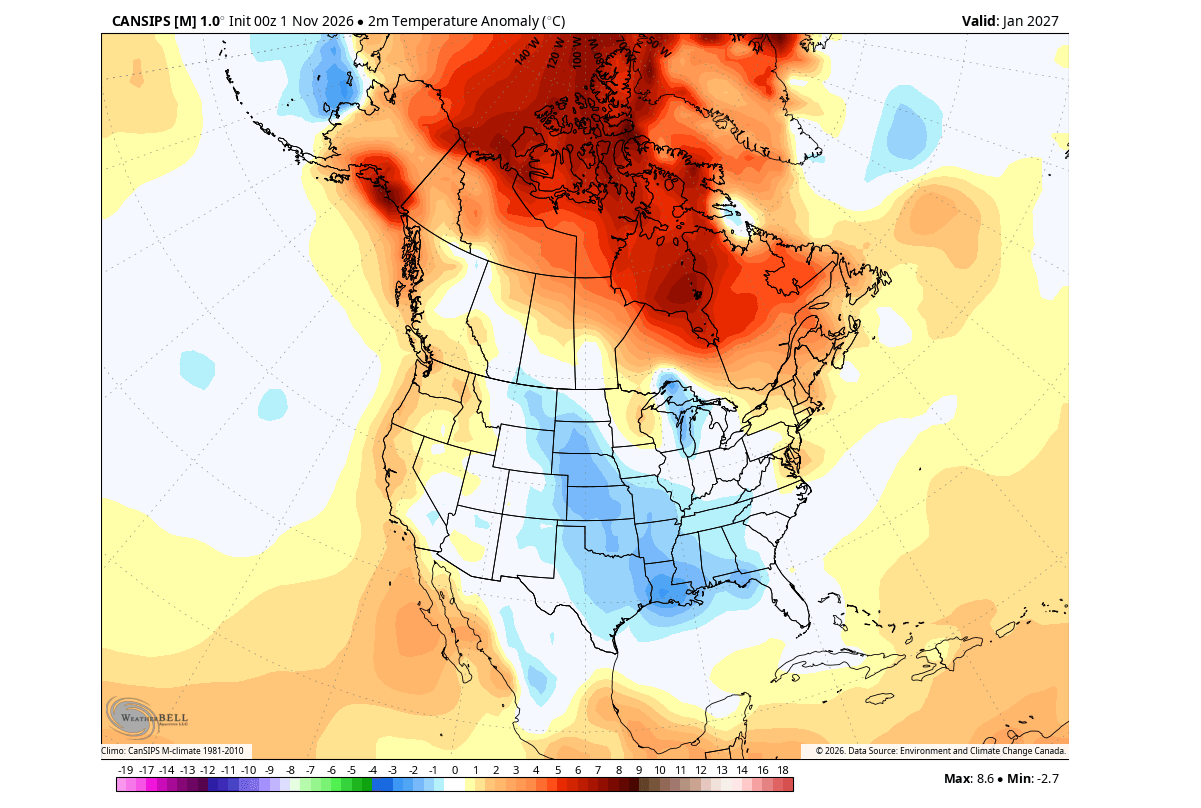
It’s most likely a development from the strong Super El Niño push rather than the current Polar Vortex disruption event, but the signal is still interesting to see.
For the snowfall forecast, we have to look at some better models, of which the best is usually the ECMWF, based on experience. I am still waiting for the latest data to be released by the end of this week. But even the October calculations showed an interesting positive snowfall anomaly over the western, central, and eastern United States in January.
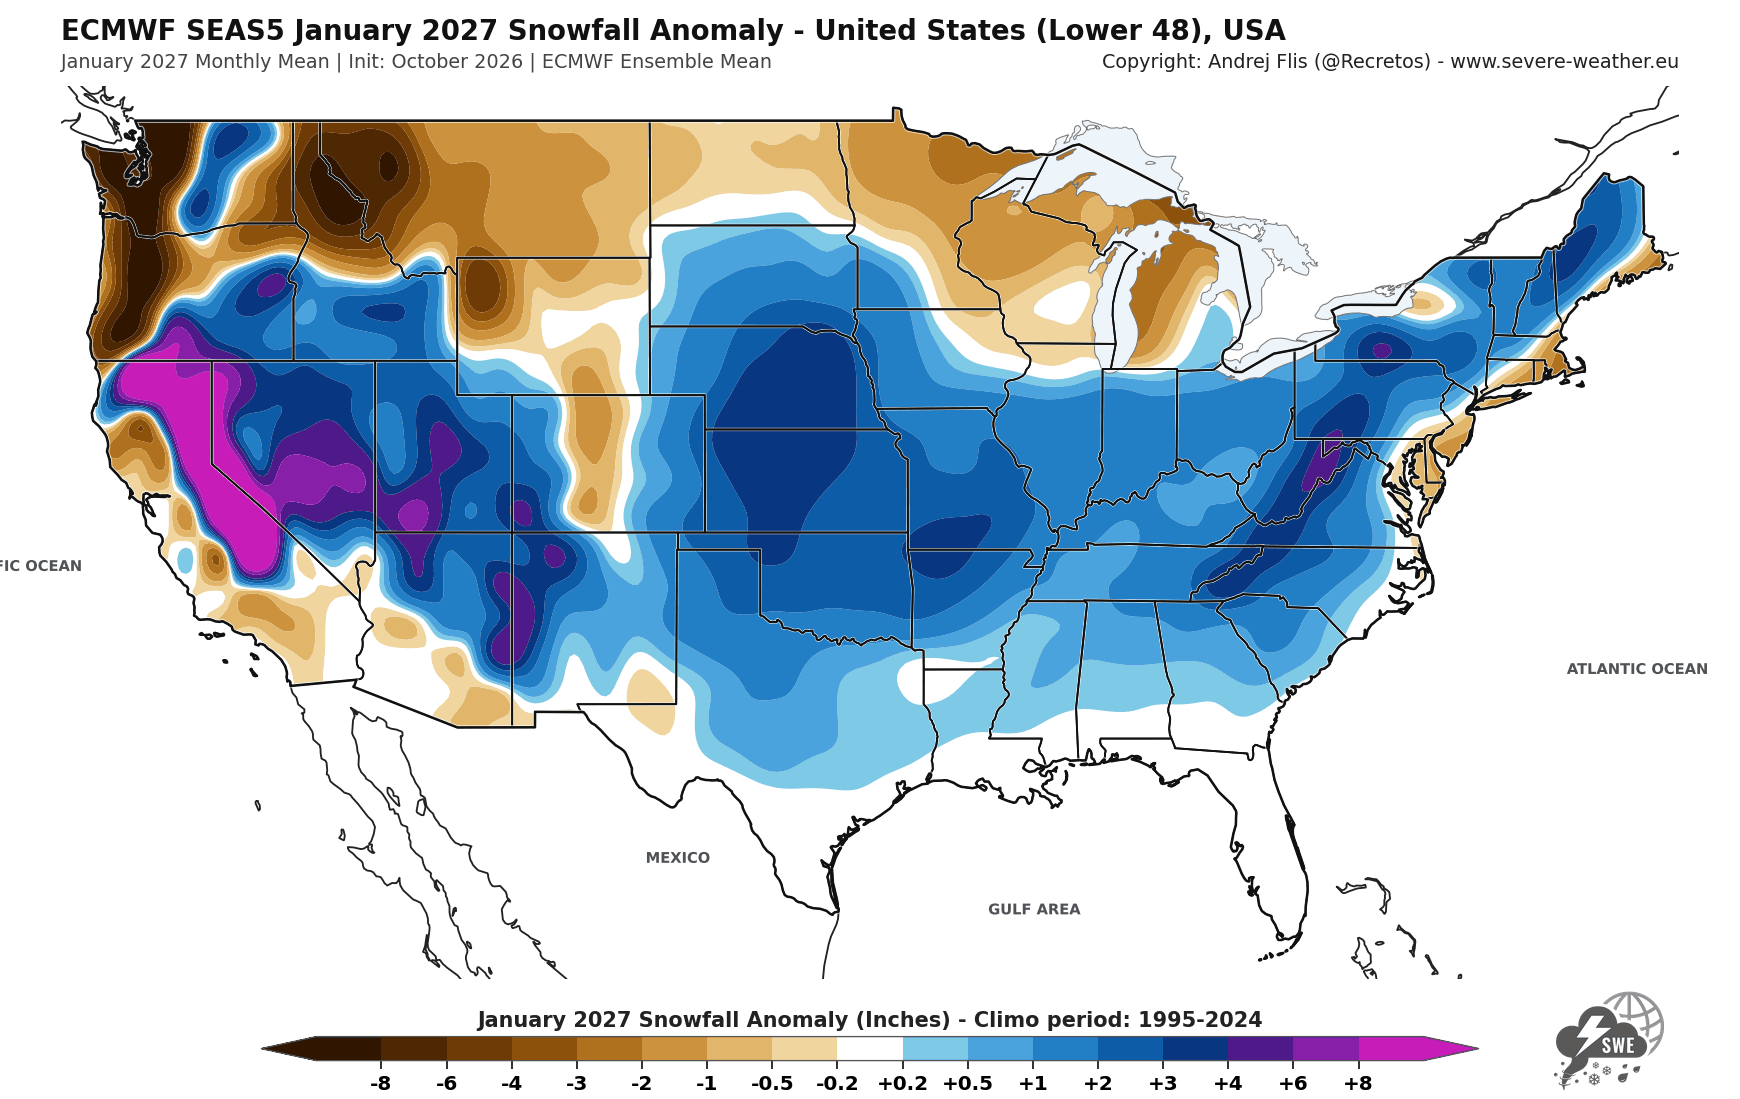
This is also a very likely Super El Niño-driven pattern, though the snowfall anomaly looks similar to the post-November stratospheric warming event signal above for the central and eastern United States. This just shows that there are a lot of global factors at play that can contribute to the final weather outcome.
Over Europe, the early Stratospheric Warming signal shows a reversed temperature signal for January: the below-normal temperature anomaly now sits over the western, north-central, and northern parts. At the same time, a warm anomaly rises toward the east, replacing the cold anomaly in December.
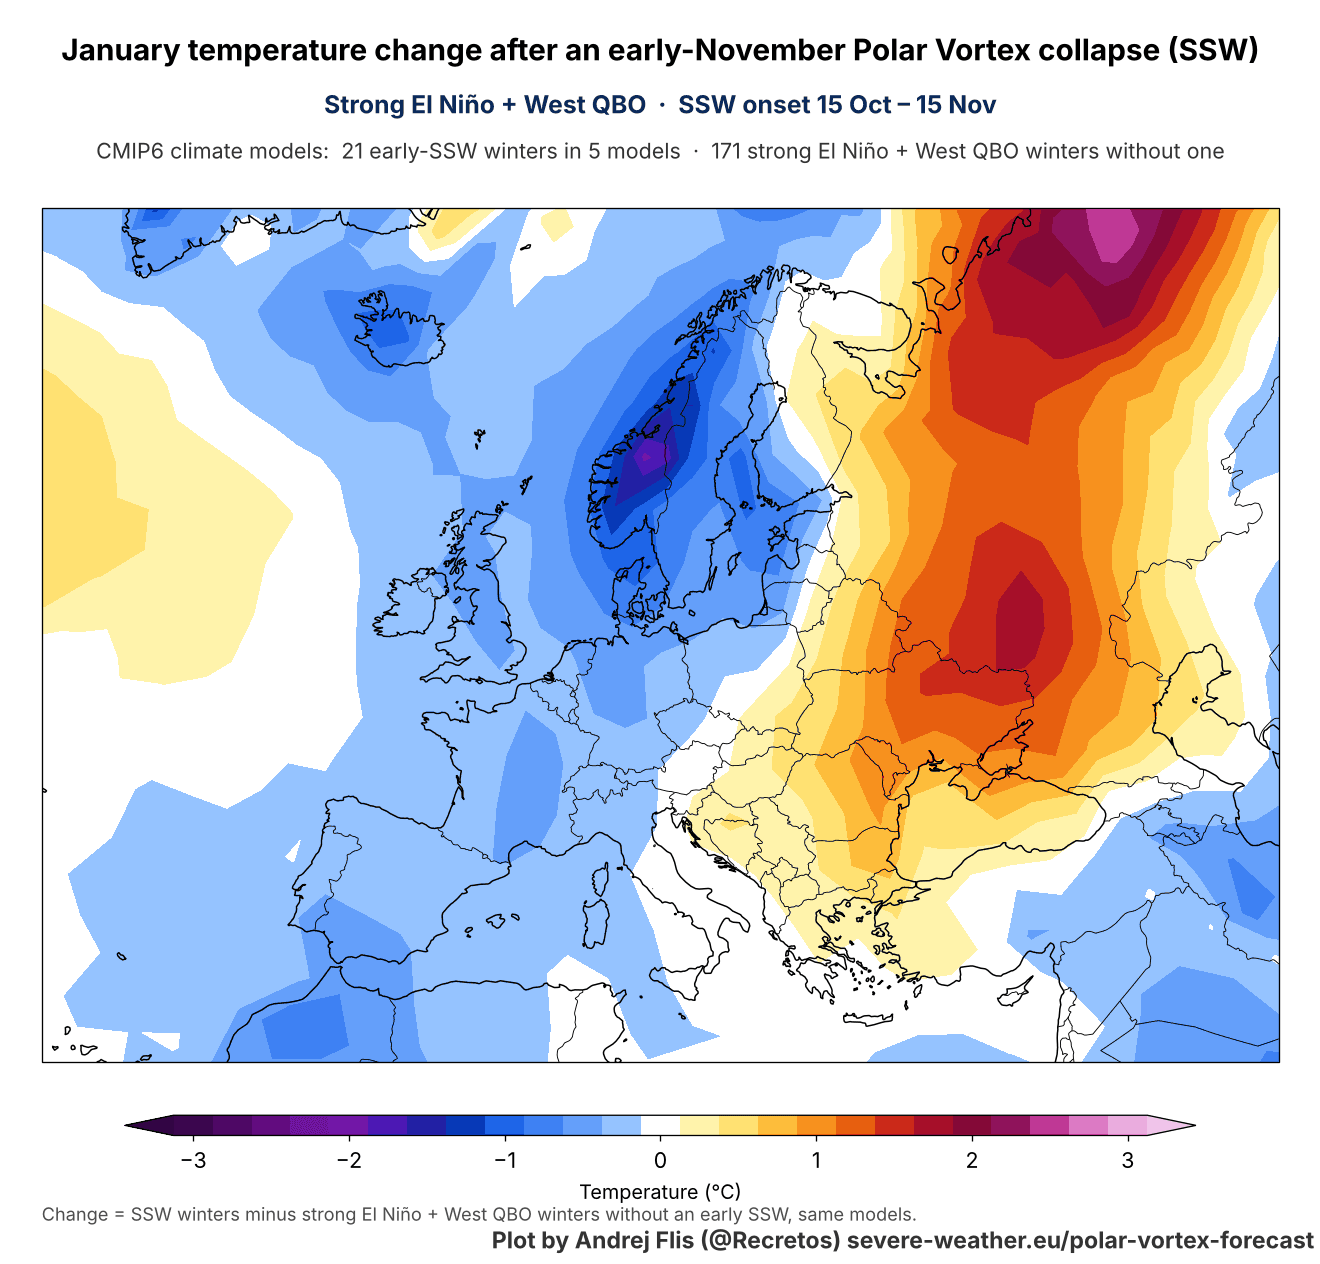
As always, snowfall follows moisture and cold air. So the snowfall signal for January shows increased snow over much of the central, western, and northwestern parts, under the northerly flow, meeting the Atlantic and Mediterranean moisture.
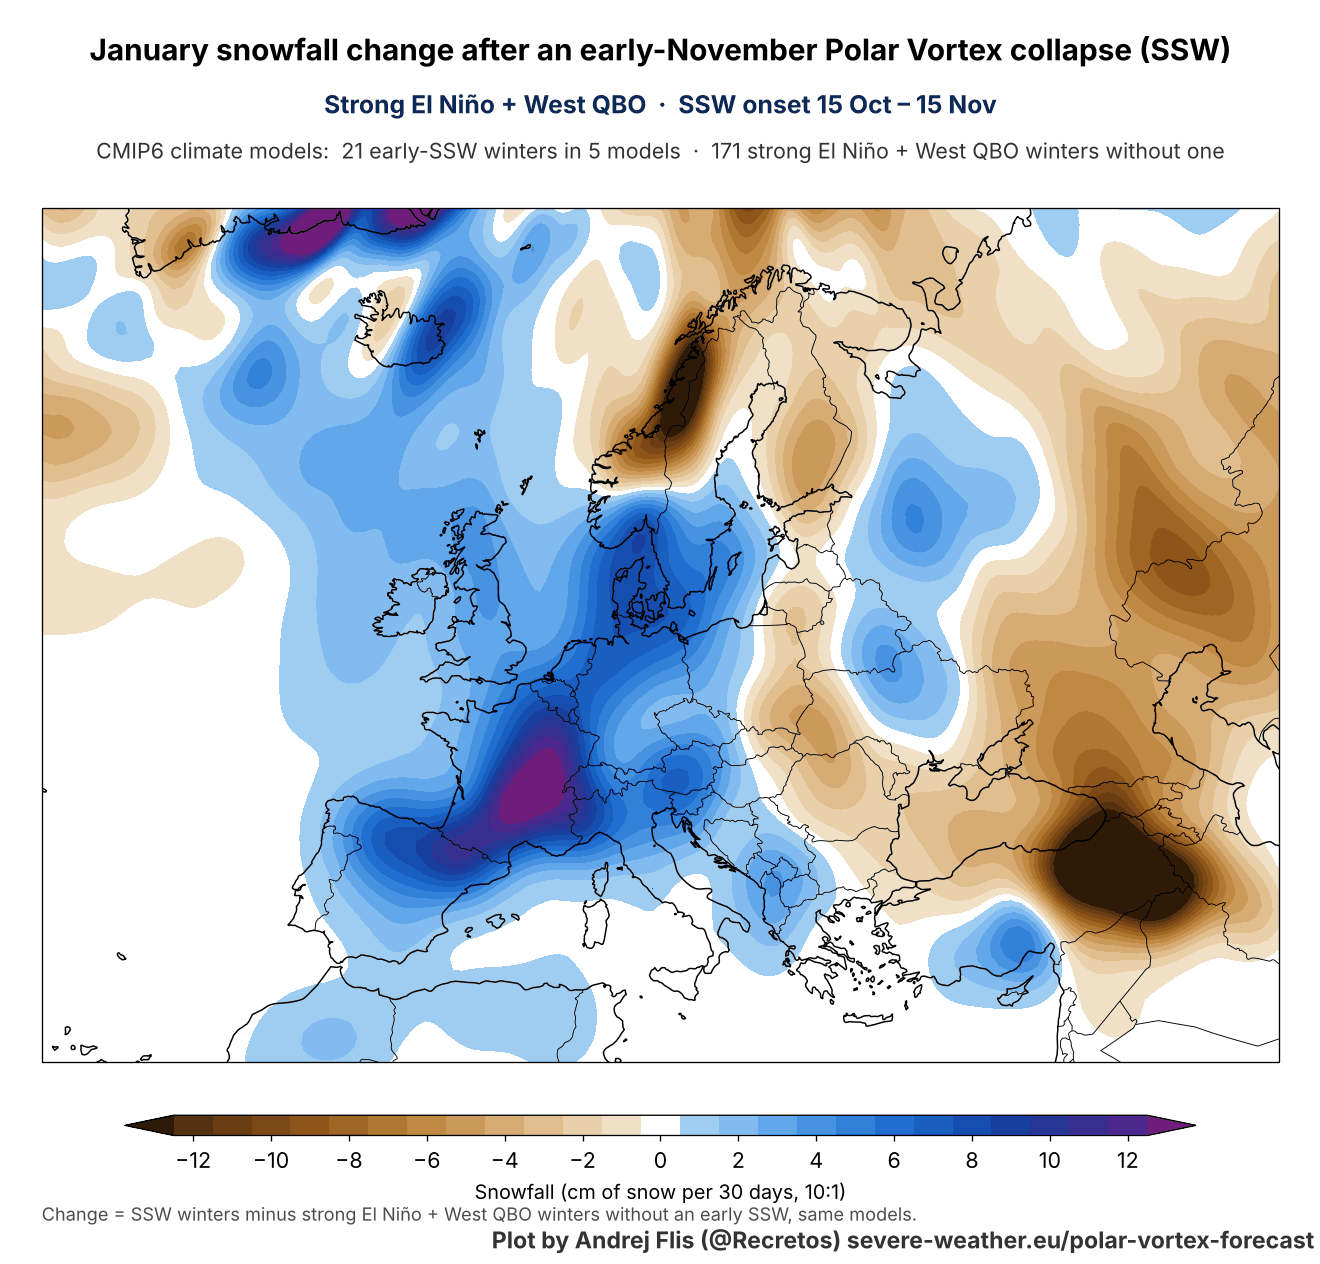
As said, all these signals from the early November SSW are how they appear in global weather/climate simulations. These are not forecasts, but we can see them as the weather pattern that the stratospheric warming is trying to push onto us in ideal conditions.
You can find all our custom Polar Vortex graphics live on the Polar Vortex Forecast hub page.
The SSW impact maps are based on CMIP6 climate model data. Forecast images are made from ECMWF and NCEP GEFS data, with the CanSIPS image sourced from WeatherBell (commercial license).