A first look at the Winter 2024/2025 forecast shows the influence of a weak La Niña phase. This phase will change the usual jet stream pattern over North America and the Pacific Ocean, extending its reach to the rest of the world. We are also monitoring a potentially weaker-than-normal Polar Vortex for the first half of Winter.
The global weather system has many large-scale and small-scale driving factors. The main factor this year will be a weak La Niña event in the Pacific, but we also expect the Polar Vortex to show its colors once winter begins.
Below is an example of a weather pattern from an older La Niña winter: A blocking high pressure over Greenland and the North Pacific, with low pressure and colder air from west Canada into the United States. Over Europe, we see a cutoff low-pressure area bringing cold and snow into central parts.

WEAK LA NINA EMERGING
La Niña is a cold phase of the large and powerful oceanic ENSO oscillation. It is a region of the tropical Pacific Ocean that shifts between cold and warm phases. The cold ENSO phase is called La Niña, and the warm phase is called El Niño.
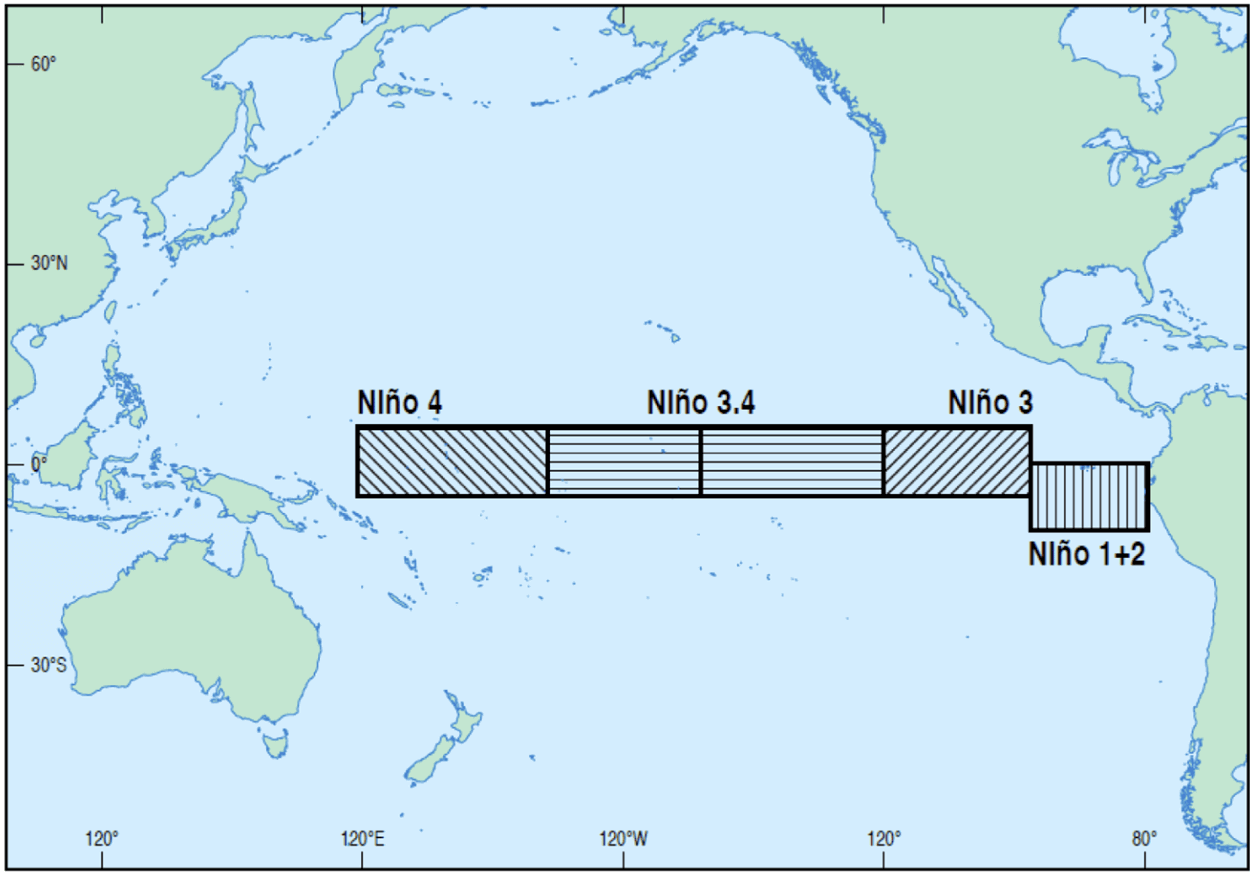
These ocean temperature anomalies (warmer or colder) occur in specific regions of the Pacific Ocean, as shown in the image below. The main region is 3.4 and is also the main area where we determine what phase is active and how strong it is.
Below is the latest mid-August ocean anomaly analysis from NASA. It shows colder-than-normal surface waters in the central and eastern ENSO regions. These cold anomalies have a “wave-like” shape. This is because of the strong easterly trade winds that push the waters towards the west, creating swirls on the ocean surface.

These cold anomalies are the initial development signs of the next La Niña phase emerging.
Below is an analysis/forecast image from NMME, which shows the temperature drop as the warm phase ended and the forecast of the main ENSO 3.4 region. Negative anomalies and cooling are forecast over the Autumn and Winter of 2024/2025. The forecast average is within the La Niña threshold, but it’s weaker than last month.

The image above shows that even in early spring, the ocean anomaly was still above normal. Below is a high-resolution video animation that shows how the ocean went from warm to cold anomalies across the ENSO regions in the tropical Pacific.
The ocean temperature forecast for early Winter shows that a La Niña event is active. It is not strong and will likely go down in history books as a weak event. But as you will see in the winter pressure patterns, it will leave its mark on the jet stream position.

This data gives us enough confidence that we will see some influence from these anomalies over the coming cold weather season. The question now is how exactly La Niña changes the winter weather patterns?
WINTER AND THE POLAR JET STREAM
Several winter seasons have had an active La Niña phase in recent decades. This allows us to analyze past data to see how the winter weather patterns usually develop under a La Niña.
Overall, each ENSO phase significantly influences tropical rainfall, pressure patterns, and the complex energy exchange between the ocean and the atmosphere. The image below shows the circulation pattern of La Niña and its connection to the ocean and the atmosphere.
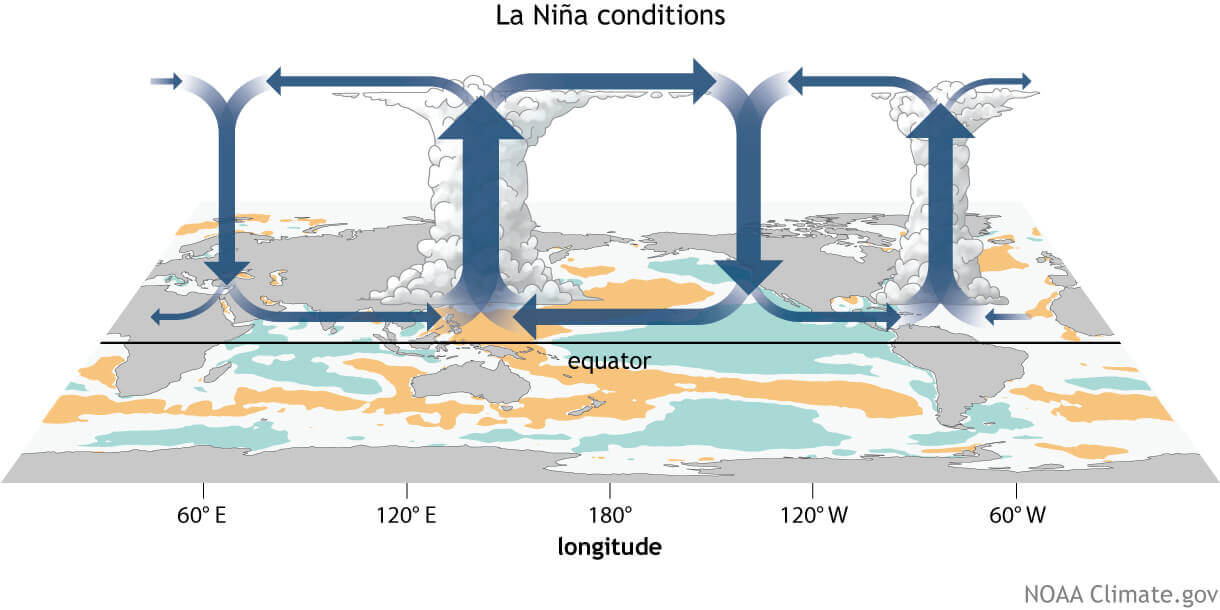
This way, the ENSO significantly impacts tropical rainfall and pressure patterns, altering the atmosphere-ocean feedback system. The ENSO influence is spread globally through this system, changing the Winter temperature and snowfall patterns over the Northern Hemisphere.
In essence, you could also say that these ocean anomalies act like control lights on the dashboard of your car. So, they not only have their own influence but also signal the overall state of the atmosphere.
The image below shows the average pattern during some of the La Niña winters in recent decades. A strong high-pressure system is visible in the North Pacific. The main low-pressure area is over Canada and the northern United States. Another low-pressure area is over southwestern Europe.

The circulation of the strong high-pressure system promotes the development of a low-pressure region over Alaska and western Canada. It curves the jet stream downwards in between the two pressure systems.
Looking at the temperature analysis for the same winters, we can see the cold anomaly under the jet stream, expanding from western Canada into the northern United States. There are also some cold anomalies over Europe, but they can’t be attributed directly to La Niña.

You can see that jet stream shift in the image below. The image shows the average position of the jet stream during La Niña winters and the resulting weather patterns over the United States and Canada.

The displaced jet stream brings colder temperatures and winter storms from the polar regions down into the northern and northwestern United States. Warmer and drier winter weather prevails over the southern states.
In the northern part of the country, colder and wetter events are more frequent, as the jet stream directs the storm systems that way. But, this can lock out the southern United States from cold air, creating warmer and more stable weather with fewer storms and cold fronts over the south.
Colder air is more easily accessible to the northern United States, increasing the snowfall potential when moisture is available. The image below shows the average snowfall pattern for weak La Niña years, as expected for this Winter season.

In addition to the northwestern United States and the Midwest, there is increased snowfall potential over the northeastern United States and eastern Canada. This image is typical for a weak La Niña event, but every year has its own variations.
So, as we now know what to expect from the winter patterns based on past weather alone, we will continue to the actual Winter 2024/2025 predictions.
WINTER 2024/2025 – ECMWF FIRST FORECAST
For the early Winter forecast, we looked at three seasonal models: the ECMWF from Europe, the CanSIPS from Canada, and a special blend of North American models called NMME. Graphics are from ECMWF, TropicalTidbits, and CPC/NCEP.
All these forecasts are an average picture over three meteorological winter months (December-January-February) and show the general prevailing weather patterns.
Even if the models were 100% accurate, it does not mean such weather conditions would last for three months straight. It only suggests how the weather patterns might look most of the time.
The winter pressure pattern forecast from ECMWF below shows an obvious La Niña high-pressure system in the North Pacific and a low-pressure area over Canada. The high-pressure area extends from the southern United States across the Atlantic into western and central Europe.

Overall, this pushes the jet stream into the northern and northwestern United States. But over Europe, the jet stream is pushed further to the north, thanks to the high-pressure area.
The surface pressure anomaly also shows an interesting pattern over the tropical Pacific. A broad high-pressure area is forecast to cover the region, indicating a La Niña-type pattern. This is a sign that confirms the La Niña influence on the tropical surface-level circulation and its presence in the atmosphere.

Looking at the surface temperature forecast over Europe, we see an expected picture based on the pressure anomalies. Most of the continent is warmer than normal, under the influence of the high-pressure system extending into the continent from the Atlantic.

The precipitation forecast for Europe shows a drier signal over the west due to the high-pressure anomaly. But the rest of the continent shows more precipitation than normal.

Over North America, the first ECMWF winter forecast shows average to colder surface temperatures over most of western Canada. Warmer than normal temperatures are forecast over the southern United States, with a weaker anomaly going toward the northern and eastern United States.

The blue arrow shows a break in the above-average anomalies, indicating a potential route for cold air outbreaks.
Below is a single-month forecast for January 2025, and it shows much less warm anomaly areas. Here, the normal to below-normal area is expanded from the northwestern United States into the central parts and the Midwest.

The precipitation anomaly forecast shows a more typical La Niña-type pattern over Canada and the United States. More precipitation is forecast over Canada and the northwestern and northeastern United States. Less precipitation is forecast over the southwestern United States, as usually seen in a La Niña pattern.

Because the precipitation forecast doesn’t show us everything, we decided to take a special look at the snowfall forecast.
ECMWF WINTER 2024/2025 SNOWFALL FORECAST
Below is a special snowfall forecast from the ECMWF data. Unfortunately, the data doesn’t cover February, so the average does not contain that data. But the February data will be available in all future updates.
Looking over Europe, we see primarily below-average snowfall. More snowfall than normal is forecast over Scandinavia, due to the influence of a local low-pressure system.

Over North America, we see an interesting forecast, with most of the United States forecast with below-average snowfall. It is perhaps a bit surprising, especially for the Midwest and the far Northeast, which can get more snow in a weak La Niña winter.

More snowfall is forecast for much of the western and northwestern United States and parts of central/eastern Canada. But remember that this forecast does not yet include February, which can change the average snowfall picture.
We will soon release a special forecast article dedicated to snowfall predictions. We will analyze snowfall potential in more detail, using more models and a month-by-month breakdown.
CANSIPS WINTER SEASON FORECAST
Our second model of choice is CanSIPS from the Canadian met-office. The name stands for Canadian Seasonal and Interannual Prediction System (CanSIPS). It consists of two coupled atmosphere-ocean-land physical climate models.
This forecast shows an expected weak La Niña pattern, which we have already seen in the historical analysis. A high-pressure zone sits over the North Pacific and the Aleutians, with a low-pressure area indicated over Canada.

Another high-pressure area is over northwestern Europe. But, we must remember that this is the first-look forecast, so it does not yet show any defined low-pressure areas, as expected.
Looking at surface temperatures over Europe, we see the warm anomalies over much of the continent. We can see an area of normal to colder temperatures in a belt across the central parts. That is the easterly flow outside the high-pressure zone, which spins clockwise.

Over North America, the Cansips model forecasts above-normal temperatures across the southern half of the United States. But it shows colder-than-normal temperatures across much of southern Canada, extending down over parts of the northern United States and upper Midwest.

But the forecast above is an average for the December to February season. Below is the Cansips forecast for February 2025. It shows the cold air anomalies reaching much further down into the northern half of the United States. This way, you can see that the average picture for the whole winter can hide some important details.

This also shows that the Winter of 2024/2025 might be off to a slower start across the central and eastern United States. But this forecasts does indicate more snowfall potential in the mid and late part of Winter across the Midwest and and eastern United States.
Looking at precipitation, the Cansips forecast is similar to the ECMWF. The model shows less precipitation over much of Europe. With above normal temperatures, this is a signal for less snowfall than normal over much of the continent.

We can also see a very similar precipitation forecast over North America. Drier-than-normal conditions will prevail over the southern half of the United States, while more precipitation is forecast for the northwestern United States.

This shows a different forecast than the ECMWF and perhaps less of a La Niña pattern than expected. The main snowfall potential in this forecast is over the northern United States, the upper Midwest, and southern Canada.
NMME WINTER 2024/2025 WEATHER FORECAST
NMME stands for North American Multi-Model Ensemble. It is a special forecast produced by combining several different North American long-range models. It is useful as it contains different calculations and weather solutions, providing an average forecast from different views.
The pressure anomaly forecast shows a strong, high-pressure system in the North Pacific resulting from the active La Niña. A low-pressure system is indicated over Canada, pushing the jet stream down over the northern United States.

The temperature forecast for North America shows this jet stream pattern. Normal to colder temperatures are forecast over the northern United States and most of Canada. Warmer temperatures are forecast south of the jet stream in most central, eastern, and southern United States.

The precipitation forecast below shows a similar pattern. More precipitation is forecast over the northwestern parts of the United States and the Midwest, while drier Winter is expected over much of the southern United States. More precipitation is also forecast across parts of southwestern and southeastern Canada.

Overall, this shows a textbook weak La Niña Winter pattern unfolding, with a “double character” over the United States, from colder to the north to warmer over the south.
WINTER 2024/2025 OFFICIAL OUTLOOK
Below is NOAA’s official Winter 2024/2025 temperature forecast for the United States. It shows the winter temperature probability, with colder chances in the northern United States. As seen in the models above, the southwestern part of the country and the east coast have a higher probability of warmer than normal weather.

But take note of the trough of “equal” temperatures extending down low into the Midwest. That can be interpreted as a potential route of winter cold air outbreaks from the north into the east-central United States.
The official precipitation forecast is also quite similar to the model forecast. We see an equal-to-high probability of more precipitation (and snowfall) over the northern half of the United States. The southern United States is forecast to have a drier-than-normal winter season.

In a typical La Niña winter, there is usually a problem with the persistence of drought conditions in the south and southwest.
Overall, the forecasts show a very obvious La Niña influence. But, one very important factor can change the course of Winter at any time: the stratospheric polar vortex. Unlike the La Niña, which works on a long time scale, the polar vortex is more of a subseasonal driver.
THE POLAR VORTEX EFFECT
The Polar Vortex re-emerges every Autumn and plays a key role in weather development over the Winter and into Spring. For this reason, we have to take a quick look at its importance and early forecast.
The Polar Vortex is a large cyclonic area that spins over the entire Northern Hemisphere, from the ground up to the top of the stratosphere, reaching over 50km/31miles in altitude.
Below is an image that shows a 3-dimensional model of the Polar Vortex, extending from the lower levels up into the stratosphere. The vertical axis is greatly enhanced for better visual purposes. This image shows the actual structure of the Polar Vortex, otherwise invisible.

In the example above, the polar vortex underwent a temporary warming event. These events can disrupt the polar vortex, weaken its circulation, and change the weather patterns below.
We use the westerly stratospheric winds around the polar vortex to analyze its strength. This is basically like a jet stream but in the polar stratosphere. Strong stratospheric winds mean a strong polar vortex and weak winds can indicate a disrupted polar vortex. But why does it matter?
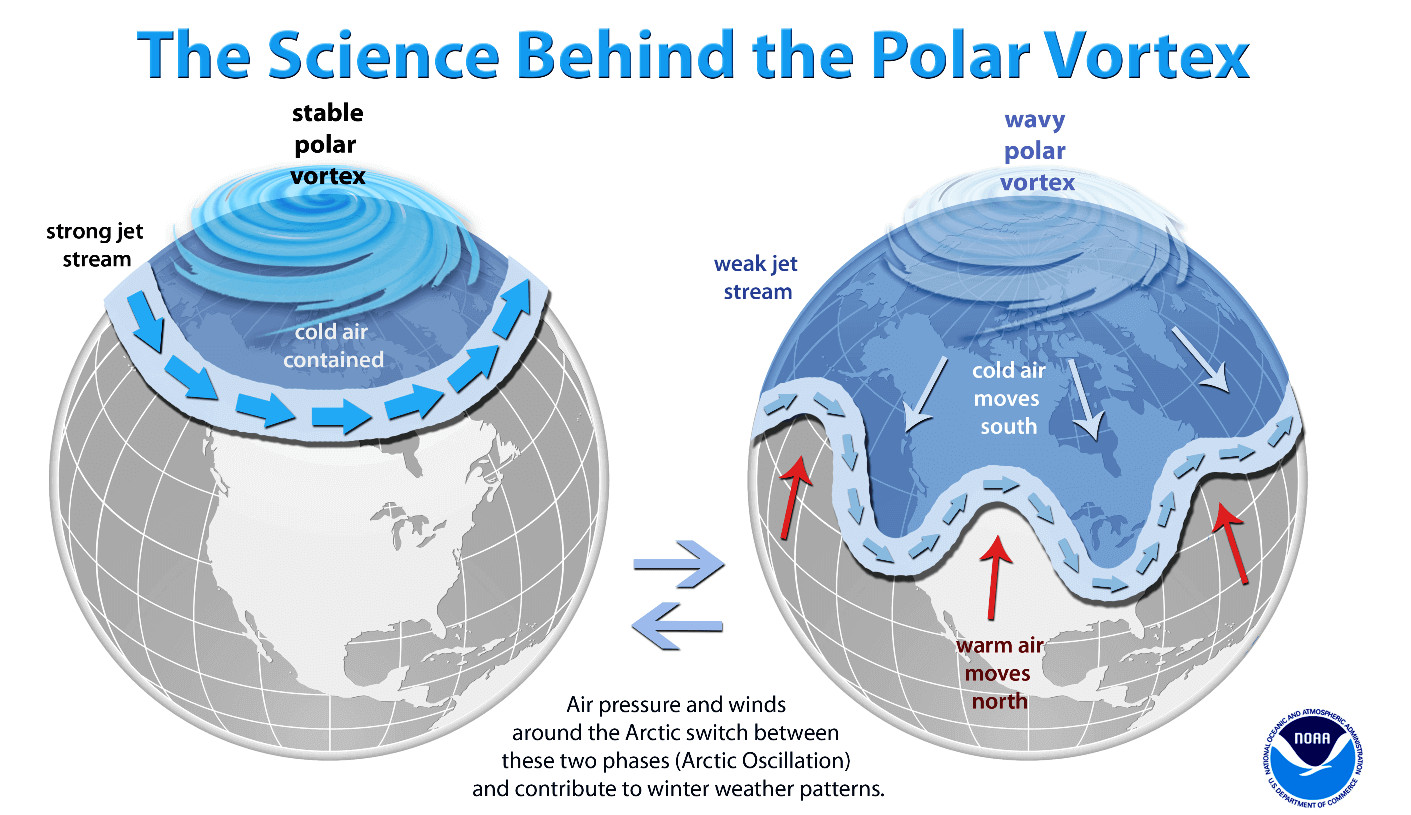
A strong Polar Vortex usually means strong polar circulation. This usually locks the colder air into the polar regions, resulting in milder seasonal conditions for most of the United States and Europe.
In contrast, a weak Polar Vortex can disrupt the jet stream pattern, making it harder to contain cold air that can now escape from the polar regions into the United States or Europe.
That is why we look at the wind speed within the stratospheric Polar Vortex to determine its strength. The stronger the Polar Vortex, the stronger the winds it produces in the stratosphere, and the stronger its impact.
It is the same for the opposite scenario, with a weaker Polar Vortex having weaker stratospheric winds. So, by looking at the wind speed forecast in the stratosphere, we can assess the state of the Polar Vortex and find early hints of its impacts.
Below is the stratospheric westerly wind speed forecast for the upcoming seasons. You can see an interesting trend developing. This ECMWF forecast for the 10mb stratospheric zonal winds shows a below-average Polar Vortex strength in late Autumn and early Winter.

Another respectable forecasting model for the Polar Vortex is the JMA model. As you can see in its forecast below, it also shows a weakening trend for late autumn and early winter with the below-average wind speed of the Polar Vortex. This is something to monitor as the updated forecasts are released in the coming weeks and months.

As winds are directly related to the strength of the Polar Vortex, we can see this as a signal for a weaker-than-normal Polar Vortex.
This would imply a potentially more disrupted weather pattern and a chance of high-latitude blocking, creating more potential for a cold air intrusion or below-normal temperatures in parts of the United States and Europe.
It gives us a signal to watch, as these dynamics can have a large-scale and long-lasting impact on the weather patterns during late Winter and even into Spring.
We will keep you updated on the developing weather trends in the coming seasons, so make sure to bookmark our page. Also, if you have seen this article in the Google App (Discover) feed, click the like button (♥) there to see more of our forecasts and our latest articles on weather and nature in general.
Don’t miss: